Reviewing the Year End Ratios Dashboard (Cognytics)
There are ten widgets in the Year End Ratios dashboard, which provide an overview of gross profit and margin, sales, accounts, and inventory information and trends in the context of the end of the year. The Year End Ratios dashboard aggregates key ratio metrics as of the end of the fiscal year. Its purpose is to provide a snapshot assessment of the business's financial health using standard financial ratios. You can filter the data in this table by:
-
Date Range (previous year selected by default)
-
Branches (displays All by default)
This dashboard is particularly important for Owners, Branch Managers, and Store Managers as they assess the business's year-to-date health or at the end of the fiscal year (after all data is in). You can reset the date range and branch information to view different data as needed.
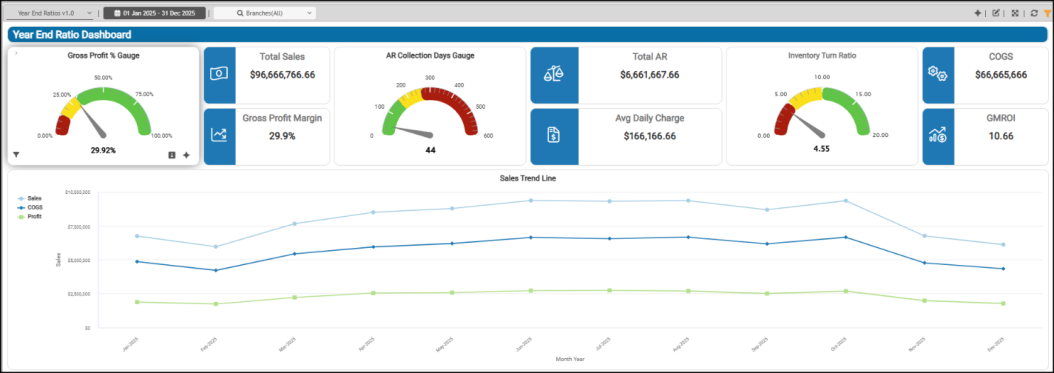
Year End Ratios Dashboard
AR Collection Days Gauge Widget (Year End Ratios Dashboard)
Widget Name: AR Collection Days v1.0 with Target
View Name: COG_VW_ARcollectionDays
Historical: No
Drill-Down: None
The Accounts Receivable Collection Days gauge widget reports the average days to collect receivables from customers.
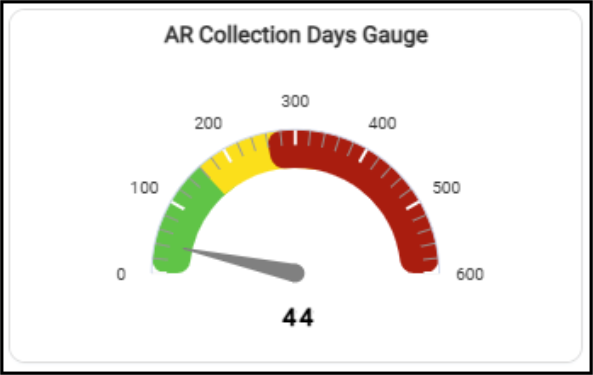
Year End Ratios Dashboard > AR Collection Days Gauge Widget
This widget uses the branch totals over the past 12 months for net sales (charge sales – charge credits) and current accounts receivable balances using the customer master data. For clarity, these are the calculations we are referring to:
-
Average Days to Collect = Total Receivables / (Total Sales / Number of Days in the Period)
-
Total Receivables = Sum (Current + Past Due Balances + Finance Charges) minus Credit Balances.
-
Average Sales = Sum (Charge Sales - Charge Returns for the prior 12-months) / 365
The AI Insights for this widget might include:
-
Business Interpretation:
"The current analysis indicates that the average Accounts Receivable collection period stands at approximately <number of days>. This metric represents the average number of days it takes for the business to collect payments from customers after credit sales.” -
Potential Business Decisions:
“Given the importance of cash flow in the LBM industry, consider reviewing current credit policies and collection procedures. This could include optimizing payment terms, enhancing follow-up protocols for overdue accounts, or leveraging technology to streamline the collection process, aiming to reduce the collection period if deemed necessary.” -
Suggested Follow-Up Questions:
“How does the actual average collection period compare against our predefined target for collection?”
The filter options for this data include account information, branch settings, customer class, daily charge sale information, sales representative, target setting, and user ID settings.
Average Daily Charge Widget (Year End Ratios Dashboard)
Widget Name: AR Avg Daily Charge v1.0
View Name: COG_VW_ARcollectionDays
Historical: No
Drill-Down: None
The Average Daily Charge headline widget quantifies the average daily charge sale for the previous year. The widget displays the total by default, but you can choose a filter to review more information.
This widget uses the same view as the Average Daily Charge widget in the Accounts Receivable Dashboard.
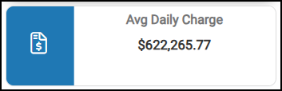
Year End Ratios Dashboard > Average Daily Charge Chart
You can filter this information by account, branch, customer class, sales representative, by collection days target, and by user information.
Cost of Goods Sold Widget (Year End Ratios Dashboard)
Widget Name: COGS v1.0
View Name: COG_VW_Inventoryturnratiobranchall
Historical: No
Drill-Down: None
The Cost of Goods Sold headline widget provides insight into the expenses associated with your inventory, a key profitability metric. This widget reports the total Cost of Goods Sold for the prior 12-month period (excluding the current month). This view uses the Stock Value table (Day 0) value for each month.
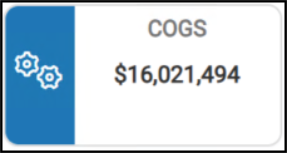
Year End Ratios Dashboard > Cost of Goods Sold Widget
You can filter this information using average inventory turns, branch ID, item description, product group, sales, and inventory turns.
Gross Margin Return on Investment Widget (Year End Ratios Dashboard)
Widget Name: GMROI v1.0
View Name: COG_VW_Inventoryturnratiobranchall
Historical: No
Drill-Down: None
The Gross Margin Return on Investment headline widget reports the gross margin return on your inventory investment for the prior 12-month period.
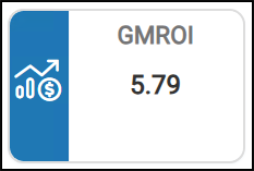
Year End Ratios Dashboard > Gross Margin Return on Investment Chart
This calculation is based on the difference between the sum of inventory sales and COGS over the previous 12 months. The inventory value is calculated based on the average of monthly valuation (On-Hand Quantity x Average Cost (converted if necessary to match unit of measures)). This calculation uses the Stock Value table records (the Day (0) value) for each month. The Inventory Turns for the year are based on the Year End Dashboard’s date selections.
You can filter this data by branch, Cost of Goods data, ROI settings, and Inventory Turns.
Gross Profit % Gauge Widget (Year End Ratios Dashboard)
Widget Name: Gross Profit Gauge v1.0 with Target
View Name: COG_VW_Grossprofitpercentgause
Historical: Yes (but Yearly only)
Drill-Down: None
The Gross Profit % Gauge speedometer/gauge shows the gross profit margin for the year using the branch (store/location) totals. This value depends on the dashboard’s Date Range setting to include the first of the year/month of the date range you are calculating the values for. For example, for the date range 2026-01-01 to 2026-03-17, the widget would include all of 2026 (even if the totals date was after March 17). If the start and end dates are 2025-01-01 to 2026-01-31, the calculation would include all sales data for both 2025 and 2026.
The gross profit percentage for the business is calculated using charged sales, charged credits, cash sales, cash credits, and cost of goods sold for the selected date range.
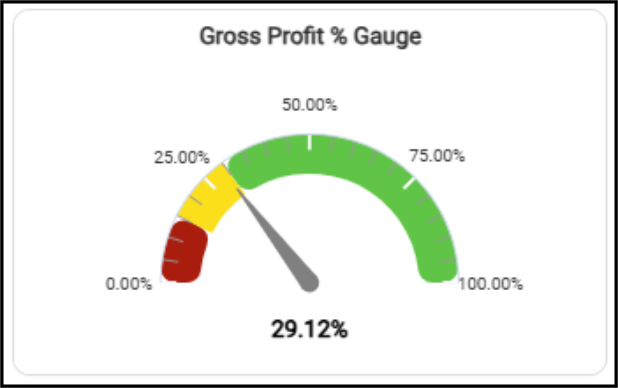
Year End Ratios Dashboard > Gross Profit % Gauge
The AI Insights for this widget might include:
-
Business Interpretations:
“The current overall Gross Profit Percentage for the business stands at approximately <percentage>. This crucial metric indicates that for every dollar of sales, about <amount> cents is retained after accounting for the cost of goods sold and related adjustments, prior to other operating expenses.” -
Potential Business Decisions:
“Establish and Monitor Benchmarks: To provide actionable context for the <amount> gross profit percentage, it is imperative to establish clear internal targets. Regularly monitor performance against these targets and, where feasible, compare with industry averages to identify areas of strength or where improvements are needed in pricing or cost management.” -
Suggested Follow-Up Questions:
"For the months with the lowest sales and profit, specifically, <lowest three months>, what was the corresponding Cost of Goods Sold (COGS) to understand the full financial picture."
You can filter the data in this widget using the branch information, cash and charge sales data, cost of goods, cost corrections, gross profit, and tax information.
Gross Profit Margin Widget (Year End Ratios Dashboard)
Widget Name: Gross Profit Margin v1.0
View Name: COG_VW_Profitmargin
Historical: Yes
Drill-Down: None
The Gross Profit Margin headline widget shows the calculated gross profit margin based on the inventory sales for the dashboard-selected date range. This calculation uses the group/section, inventory (common) data, stock value, and the branch tables. The stock value sales figures do not include sales tax.
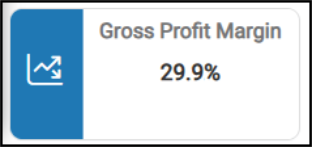
Year End Ratios Dashboard > Gross Profit Margin Chart
You can filter this table by branch information, cost of goods sold and gross margin data, product group information, and by date criteria.
Inventory Turn Ratio Widget (Year End Ratios Dashboard)
Widget Name: Inventory Turns Ratio v1.0 Gauge
View Name: COG_VW_Inventoryturnratiobranchall
Historical: No (Prior 12-months only)
Drill-Down: None
The Inventory Turn Ratio speedometer gauge widget is a key efficiency metric that shows how often your business sells and replaces its inventory year-to-date. This widget calculates the sum of sales for the prior 12-month period and divides it by the average inventory value for the same period at each branch location.
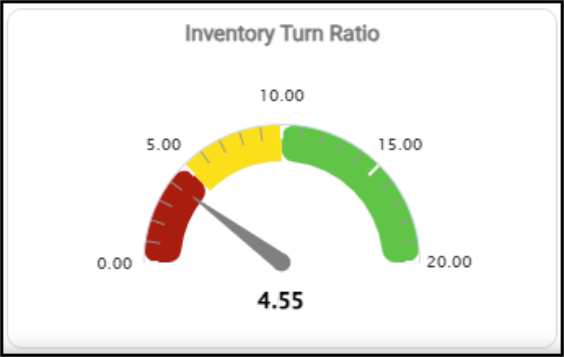
Year End Ratios Dashboard > Inventory Turn Ratio Chart
The widget calculates the weighted average cost for each product for each of the prior 12 months. To better reflect seasonal impacts to the business, the calculation does not just average the beginning and ending inventory.
Sales to Inventory Ratio = Sum(Sales) / AVG(Inventory Value)
Reviewing this calculation can help you see the balance between your sales and inventory investments. This data originates from the Stock Value table.
This widget uses the same view as the Sales-to-Inventory Ratio gauge in the Current Status Dashboard.
You can filter this list by branch data, cost of goods, profit margin, product group, sales data, and date range.
Sales Trend Line Widget (Year End Ratios Dashboard)
Widget Name: "Sales Trend Line v1.0"
View Name: COG_VW_Salestrendline
Historical: Yes
Drill-Down: Table
The Sales Trend Line graph widget plots the individual lines for Sales, COGS (Cost of Goods Sold), and Profit for each monthly period matching the Dashboard filter date selections. The widget uses the branch totals as the data source, which is grouped by year-month for the period.
Sales = (Cash Sales + Charge Sales - Cash Credits - Charge Credits - Tax)
Profit = (Cash Sales + Charge Sales - Cash Credits - Charge Credits -Tax - COGS)
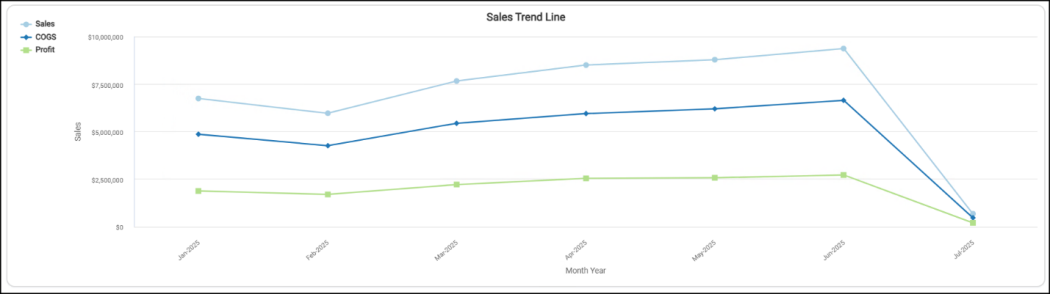
Year End Ratios Dashboard > Sales Trend Line Chart
The table view of this widget shows the specific dollar values of these calculations for each reported month, based on the date range.
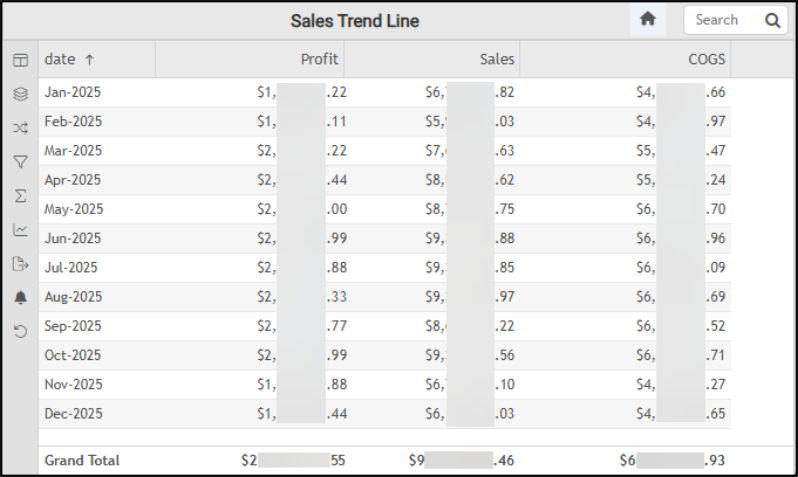
Year End Ratios Dashboard > Sales Trend Line Table
The AI Insights for this widget might include:
-
Business Interpretation:
“The provided data for <prior year> clearly illustrates a pronounced seasonal trend in sales and profitability within the LBM industry. Sales and profit consistently peak during the middle of the year, specifically from <month> through <month>, with <midpoint month> (<amount> in Sales, <amount> in Profit), <next month> (<amount> in Sales, <amount> in Profit), <next month> (<amount> in Sales, <amount> in Profit), and <next month> <amount> in Sales, <amount> in Profit) demonstrating the highest performance. This suggests a strong correlation with construction cycles or project-based demand during warmer months.” -
Potential Business Decisions:
“Optimize for Peak Seasons: Capitalize on the strong performance observed from <month> to <month six months later> by strategically increasing inventory levels, enhancing marketing efforts targeted at contractors and larger projects, and ensuring adequate staffing to handle peak demand. Focus on the best practices from <summer months> and <fall month>.” -
Suggested Follow-Up Questions:
“For the months with the lowest sales and profit, (specifically, <months listed>), what was the corresponding cost of goods sold?”
You can filter this data by branch information, cost of goods sold, date range, sales, profit, and cost of goods, and by independent calculations based on the data.
Total Accounts Receivable Widget (Year End Ratios Dashboard)
Widget Name: AR Total AR Value v1.0
View Name: COG_VW_ARcollectionDays
Historical: No
Drill-Down: None
The Total Accounts Receivable Amount headline chart shows the current amount customers owe your business, including current AR, total past-due amount, and finance charges, minus any open (unapplied) credits.
Note: This calculation does not include finance charges.
The query for this widget uses the same view as the Total AR (Year to Date) widget in the Accounts Receivable dashboard.
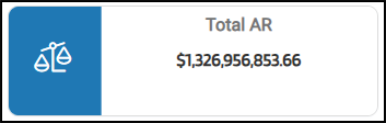
Year End Ratios Dashboard > Total Accounts Receivable Chart
You can filter the data in this widget by the accounts receivable collection days, account information, branch data, customer class, daily charge sales data, sales representative, sales totals, target amount, and user data.
Total Sales Widget (Year End Ratios Dashboard)
Widget Name: Total Sales V2.0
View Name: COG_VW_TotalSales v1.0
Historical: Yes
Drill-Down: None
The Total Sales headline widget displays the total account sales based on the dashboard’s selected date range. The account sales totals do not include tax and are calculated after returned-item sales are subtracted.
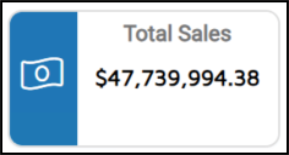
Year End Ratios Dashboard > Total Sales Chart
Note: Since this value depends on including the first day of the year, any change to the date range settings that excludes the first of the year will return zero.
See Also:
Working with Cognytics Dashboards
Current Dashboard List