Reviewing the Current Status Dashboard (Cognytics)
The Current Status dashboard provides eight widgets that offer an overview of current sales, inventory, accounts receivable (amounts and collection days), purchasing, bills, Point of Sale data, and branch amount comparisons. You can set the date range for this dashboard, but typically, it is set to Month-to-Date. This is a good starting place for users with multiple responsibilities or tasks that affect the whole business. You can also filter the data in this dashboard:
-
Date Range (defaults to current month)
-
Branches (defaults to All)
This data is useful to Back Office Managers, Purchasing and Inventory Managers, Sales and Account Managers, Store and Branch Managers, and Owners.
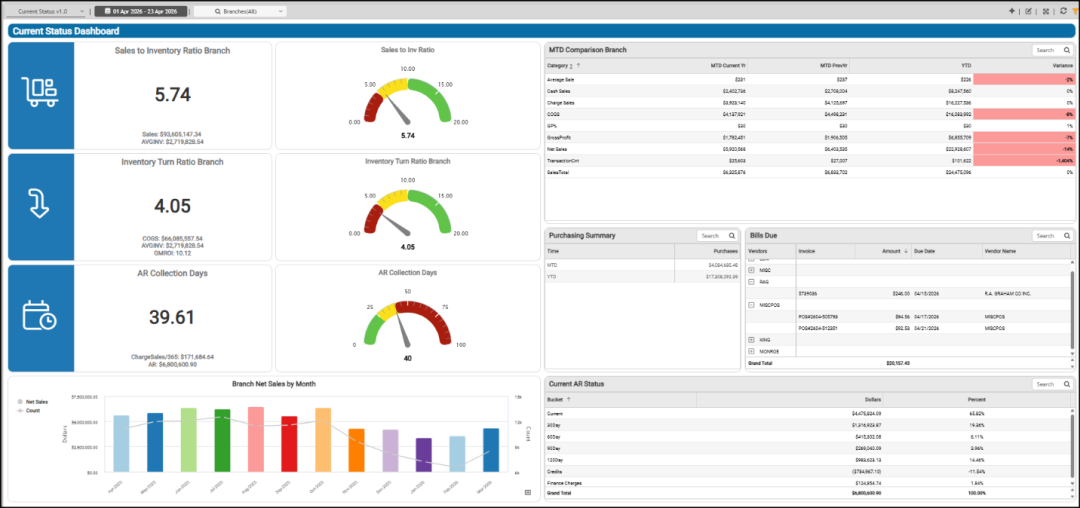
Current Status Dashboard (Overview)
AR Collection Days Widgets (Current Status Dashboard)
Widget Name: AR Collection Days CS v1.0
View Name: COG_VW_ARcollectionDaysStatus
Historical: No
Drill-Down: None
The AR Collection Days headline and gauge widgets provide data useful to Back Office team members, who have financial responsibilities. Since these widgets are built on the same query, the data is very accessible and searchable.
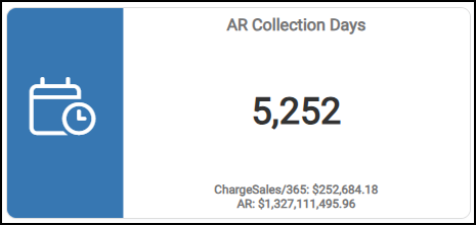
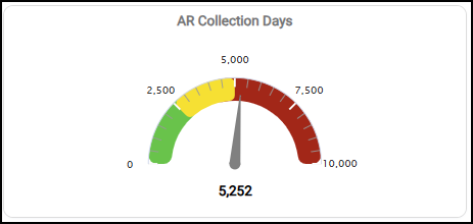
Current Status Dashboard > AR Collection Days (Chart)
In the headline widget, you get calculated values of the average collection days for receivables payments divided by the daily charge sales amounts. The AR Collections Days amount is calculated this way:
Net Receivables = Current + Past Due (30, 60, 90, 120+) + Finance Charges
- Credit Balance
Daily Charge Sales = Charge Sales – Charge Returns / 365 Days
Branch selection is not currently supported for this widget. Although accounts can optionally be assigned a branch or branch list, this is primarily a security restriction with no financial impact if the assignment changes. The application does not maintain receivables details by branch, so branch assignments are not reliable for financial purposes; you can modify account/branch assignments at any time without a financial impact.
You can filter this data using the account records, customer class, daily charge sale value, sales representative, sum amounts, and user information.
Bills Due Widget (Current Status Dashboard)
Widget Name: Bills Due Grid
View Name: COG_VW_Billdue
Historical: Yes
Drill-Down: None
The Bills Due widget shows the list of vendor payables that are currently due. When you expand the vendor record, the payment details display, including the vendor ID, invoice IDs, amount, due date, and vendor’s name. This data does not include any Paid (status 4) or Voided (status 6) payables. Expanding the nodes displays the vendors listed in order of amount (total billed) in descending order.
Note: The value in the Amount column reflects the remaining payment amount by default, so the total reflects what is actually due. The Branch setting is not taken into account, so the list includes payables from all locations.
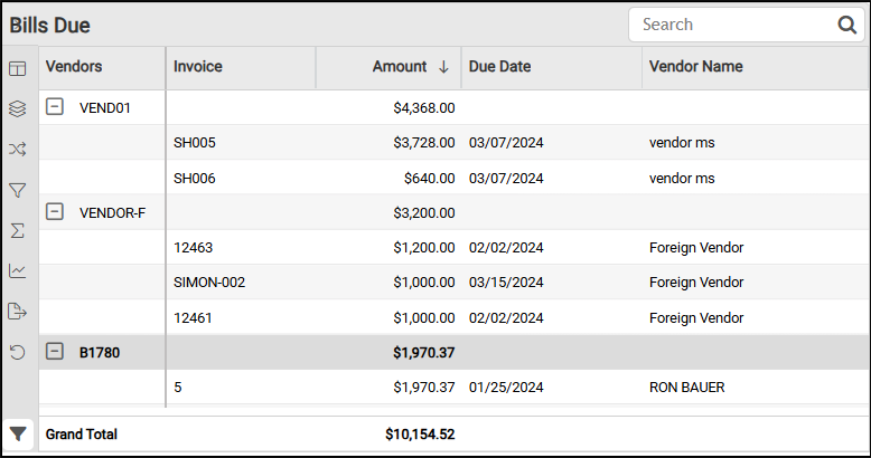
Current Status Dashboard > Bills Due Widget
The AI Insights options for this widget might include:
-
Business Interpretation:
“Significant Outstanding Bills: The data reveals a substantial volume of bills due across a diverse range of vendors. Notably, <primary vendor name> has the highest concentration of invoices with exceptionally large amounts, including single invoices exceeding <amounts>. This indicates <primary vendor name> is a primary supplier with significant financial obligations. Other vendors such as <next vendor name> <amount>, <next vendor name> <amount>, <next vendor name> <amount>, and <next vendor name> <amount>, also represent significant individual or cumulative liabilities.” -
Potential Business Decisions:
“Prioritize High-Value Payments: Immediately review and prepare for payments for vendors with the largest outstanding amounts, such as <primary vendor>, <next vendor>, and <next vendor>, to maintain strong supplier relationships and avoid potential late fees.” -
Suggested Follow-Up Questions:
“For which vendors do we have credit amounts, and what is the total credit amount for each?”
You can filter the content in this widget by billed amount, bucket, internal ID, due date, and vendor information.
Branch Net Sales by Month Widget (Current Status Dashboard)
Widget Name: Branch Net Sales by Month v1.0
View Name: COG_VW_Branchnetsalesbymonth
Historical: No
Drill-Down: Table View
The Branch Net Sales by Month bar and trend-line widget display the net sales and invoice counts for each month over the prior 12-month period. This is very useful for sales teams and branch managers as a financial assessment of the branch.
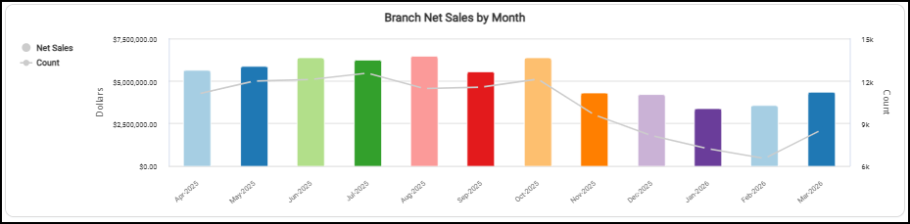
Current Status Dashboard > Branch Net Sales by Month (Prior 12 Months)
This is the calculation used to define these values:
-
Net Sales = Sum (Charge Sales + Cash Sales – Cash Credits – Tax)
-
Invoice Count = Counts for Cash Invoices and Charge Invoices
When you look at this data as a table, you see the net sales data and count information side by side.
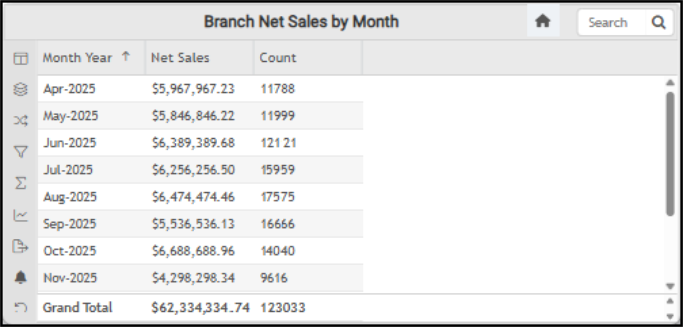
Current Status Dashboard > Branch Net Sales by Month (Year over Year)
The AI Insights options for this widget might include:
-
Business Interpretation:
“Top Sales Performance: The data reveals that <highest month/year> recorded the highest net sales at <amount>, closely followed by < second-highest month/year> at <amount> and <third-highest month/year> at <amount>. This indicates a strong performance period for the business during the summer and early fall months.” -
Potential Business Decisions:
“Capitalize on Peak Season Success: Analyze the operational strategies, marketing campaigns, and inventory management approaches used during the high-performing months of <highest three months>. Understanding these successful elements can help in replicating and optimizing performance in future peak seasons.” -
Suggested Follow-Up Questions:
“How do these monthly sales and transaction trends from <current year range> compare to the performance from the previous year?”
You can further filter this list by branch, item count, monthly sales, monthly count, and year/month data.
Current AR Status Widget (Current Status Dashboard)
Widget Name: Current Status Current AR Status v1.0
View Name: COG_VW_Currentarstatus
Historical: No
Drill-Down: Table View
The Current AR Status table widget displays aged balance information and shows the value of each bucket as a percentage of total sales. You can filter these values by account, bucket, customer class, AR amount, percent of total AR aged amounts, and sales representatives.
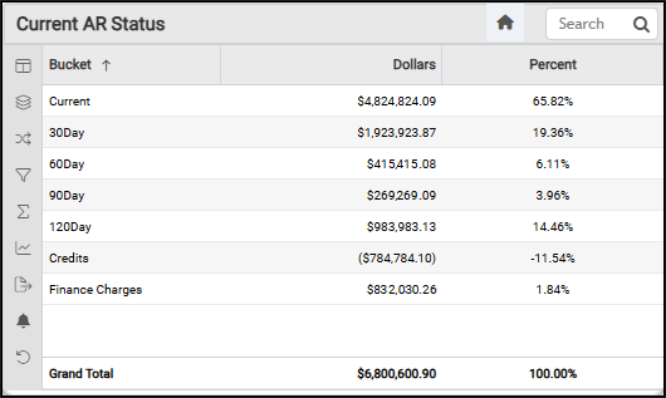
Current Status Dashboard > Current AR Status (Aged Balances) Table
The AI Insights options for this widget might include:
-
Business Interpretation:
“The Accounts Receivable (AR) health shows that the majority of receivables are current, with <amount> representing <percentage> of the total. This indicates a strong foundation of timely payments.” -
Potential Business Decisions:
“Streamline Credit Management: Develop and implement a proactive strategy to address the outstanding credit balances. This should include identifying customers with credit balances, offering to apply credits to future purchases, or processing refunds promptly to improve customer relationships and reduce the liability.” -
Suggested Follow-Up Questions:
“Which individual customer accounts contribute the most to the significantly high balances in the 120-day overdue category?”
You can filter these values by account, bucket, customer class, AR amount, percent of total AR aged amounts, and sales representatives.
Inventory Turn Ratio Branch Widgets (Current Status Dashboard)
Widget Name: Inventory Turn Ratio Branch All
View Name: COG_VW_Inventoryturnratiobranchall
Historical: No (Prior 12-months)
Drill-Down: None
The Inventory Turn Ratio by Branch headline and gauge widgets show the calculated costs associated with inventory turns for the selected branch locations for the prior 12 months. This combination of widgets is helpful to Inventory Managers and Purchasing Agents responsible for managing the business stock. In these charts, you see the total cost of goods sold (COGS) and divide it by the average inventory value within the period. This can also serve as a touchstone for Branch Managers, who can use this overview to evaluate the current movement of inventory.
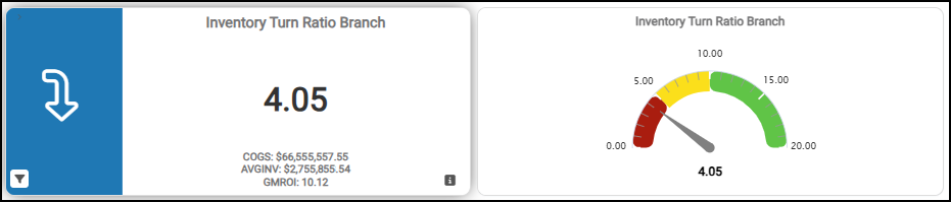
Current Status Dashboards > Inventory Turn Ratio Branch
You can sort and filter these charts by branch, dates, return on investment data, cost of goods assessments, and dates.
MTD Comparison Branch Widget (Current Status Dashboard)
Widget Name: MTD Comparison Branch ALL v1.0
View Name: COG_VW_Mtdcomparisonbranch
Historical: No (Based on Current Date)
Drill-Down: None
The Month-to-Date Comparison Branch table widget displays month-to-date sales values from the Branch Table records. This data is useful to Sales Management for a particular branch, Store/Branch Managers, and Owners.
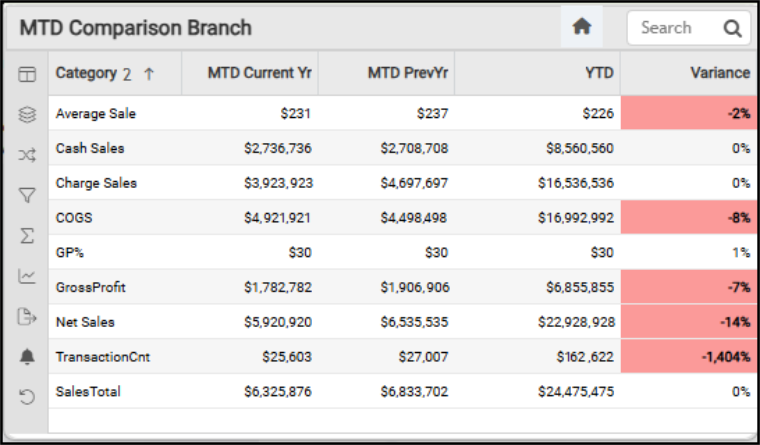
Current Status Dashboard > Month to Date Comparison (Branch)
The MTD Current Year column reflects the current month-to-date values for the current year.
The MTD Previous Year column reflects the current month-to-date values for the previous year.
The YTD column reflects the totals for the current year to date.
The Variance % column entry is based on this calculation:
MTD Current Year – MTD Previous Year X 100
Month to Date (Previous Year)
The Category value calculations are based on the Branch table data and this is how each of these values is calculated:
-
Average Sale = SUM(Net Sales / Transaction Count)
-
Cash Sales = SUM(Cash Sales -Cash Credits)
-
Charge Sales = SUM(Charge Sales -Charge Credits)
-
COGS = SUM(COGS) *Cost of Goods Sold
-
Gross Profit % = SUM( ( Gross Profit / ( Net Sales + 0.01 ) ) * 100 ) {0.01 added to avoid Divide by Zero Exceptions}
-
Gross Profit (Amount) = SUM(Cash Sales + Charge Sales - COGS -
Cash Credits - Charge Credits -Tax -Cost Corrections) -
Net Sales = SUM(Cash Sales + Charge Sales - Cash Credits - Charge Credits -Tax)
-
Transaction Count = SUM(Cash Invoices + Charge Invoices)
-
Sales Totals = SUM(Cash Sales + Charge Sales - Cash Credits -
Charge Credits)
The AI Insights options for this widget might include:
-
Business Interpretation:
“Reduced Gross Profit, but Improved Gross Profit Percentage: While Gross Profit MTD is <status> at <amount> (a <percentage> variance from the previous year's <amount>), the Gross Profit Percentage (GP%) has actually seen a positive variance, increasing by <percentage> to <new percentage> in the current MTD (up from <percentage> last MTD). This is a critical insight, suggesting that despite selling less volume, the profitability per dollar of sales has improved, or the cost of goods sold (COGS) has been managed more efficiently relative to sales prices on the units sold.” -
Potential Business Decisions:
“Optimize Inventory and Purchasing: Review current inventory levels and purchasing strategies in light of reduced COGS and sales. Ensure that inventory is optimized to meet demand without incurring excessive carrying costs, while also taking advantage of potentially improved purchasing terms or pricing strategies.” -
Suggested Follow-Up Questions:
“How do the daily average metrics compare across the various categories?”
You can filter this data using the month-to-date branch data settings.
Purchasing Summary Widget (Current Status Dashboard)
Widget Name: Purchasing Summary v1.0
View Name: COG_VW_Purchasingsummary
Historical: No
Drill-Down: None
The Purchasing Summary table widget shows the month-to-date and year-to-date purchasing amounts. You can filter this information by branch, but this widget includes all branches by default.
Note: This data is based on received inventory rather than purchase orders alone.
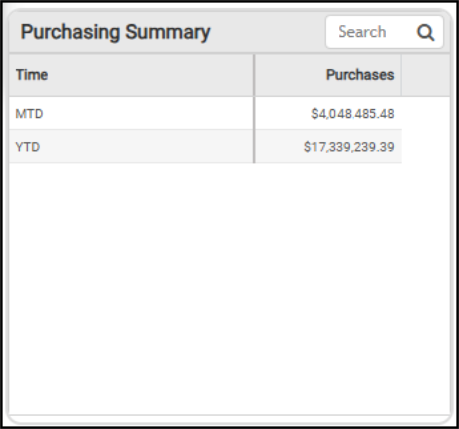
Current Status Dashboard > Purchasing Summary
The AI Insights options for this widget might include:
-
Business Interpretation:
“The Month-to-Date amount indicates continued strong purchasing momentum into the current period, which is crucial for maintaining stock levels and fulfilling customer orders in a dynamic market.” -
Potential Business Decisions:
“Given the substantial Year-to-Date purchasing volume, it is recommended to conduct a comprehensive review of vendor contracts and pricing terms to ensure optimal cost efficiency and leverage bulk purchasing power.” -
Suggested Follow-Up Questions:
“Can we see the total purchase amounts for each vendor year-to-date?”
You can filter this data using branch and vendor code settings.
Sales to Inventory Ratio by Branch Widgets (Current Status Dashboard)
Widget Name: Sales to Inventory Ratio v1.0
View Name: COG_VW_SalestoInventoryRatioCurrentStatus
Historical: Yes (Limited Range to Prior 12-months)
Drill-Down: None
The Sales-to-Inventory Ratio headline and gauge widgets provide a financial metric showing how efficiently your business manages its inventory relative to its sales. These two widgets use the same calculation method (the sales total for the previous 12 months divided by the average inventory value for the same period). The headline widget displays the amounts and calculated values, while the gauge widget shows the same data graphically.
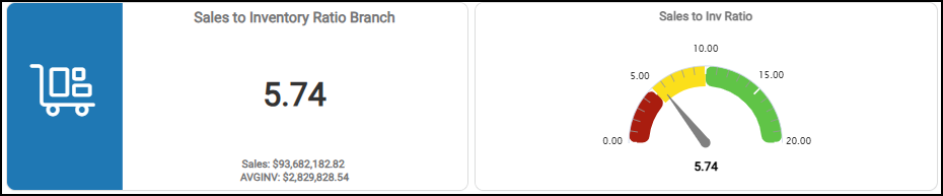
Current Status Dashboards > Sales to Inventory Ratio by Branch
This information is helpful for assessing inventory turnover and liquidity, as well as for identifying excess inventory and stock shortages. You can filter this information by branch and explore sales and inventory pricing by product group and by item. These two widgets show the same data in different forms.
See Also:
Working with Cognytics Dashboards
Current Dashboard List