Building Custom Dashboards
Dashboards organize the views and widgets you have built into one platform, displaying related data simultaneously to users who need it. When you want to build a consistent resource for yourself or your team, you collect the most relevant views and widgets into a Dashboard.
When you build dashboards, focus on the audience and build two kinds of dashboards:
For Executives, build dashboards that focus on key performance indicators, market or financial trends, and widgets and views that summarize insights
For Operations teams, build dashboards that provide relevant operations detail (based on their focus), status tracking, and daily metrics so they can stay up on the latest details
For each dashboard, group related widgets logically by the business area each person is responsible for, and use consistent sizing and alignment so users can view the information easily. Limit the number of dashboards to 6-10 to improve readability. Give these users filters that allow them to break down the data into smaller pieces (including date range, branch, or product group) based on the work they do. Focus on clarity of the data using color and size tools to emphasize key metrics. The most important widget should be placed in the top left, as that is where users (who read left to right) naturally focus.
The best advice is to ensure the data tells a story using a widget sequence. Consider this example:
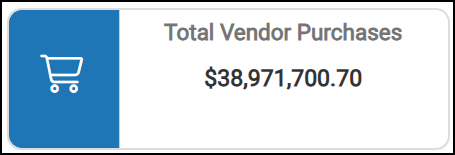
Overview Widgets > Total Vendor Purchases
An overview widget provides a high level view of information within the Dashboard’s specified date range.
For example: the Total Vendor Purchases widget collects the purchase receipts for all product groups in the date range. This is useful to understand the overall cost of your inventory.
Detail Widgets > Purchases by Vendor
Detail widgets, like Purchases by Vendor, show the total purchase amount for each vendor, giving you an idea of which vendors supply you the most inventory. A Detail Widget still provide a higher level of data, in this case, providing a list of products purchased from vendors (largest to smallest) and see a list of the vendors involved.
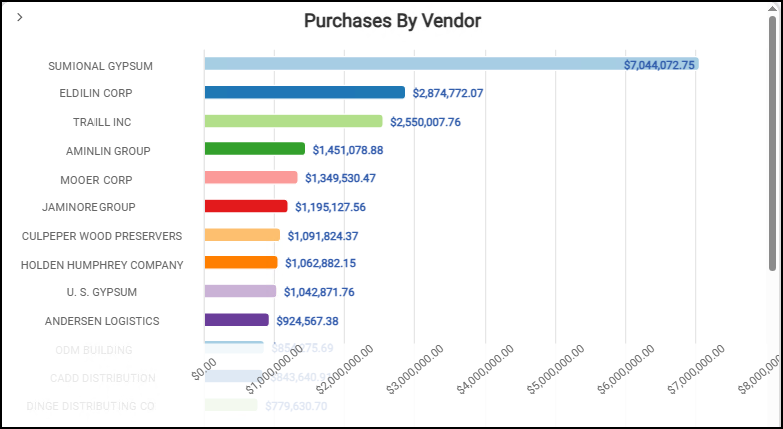
Purchases by Vendor > Provides Detail by Vendor of All Purchases
Drill-Down Widgets > Product Group Breakdown by Vendor
Drill-down widgets, like the Product Group Breakdown by Vendor, allow users to break down that total purchase value by product groups and vendors by dates, so they can determine when the business happened and what the individual order costs were.
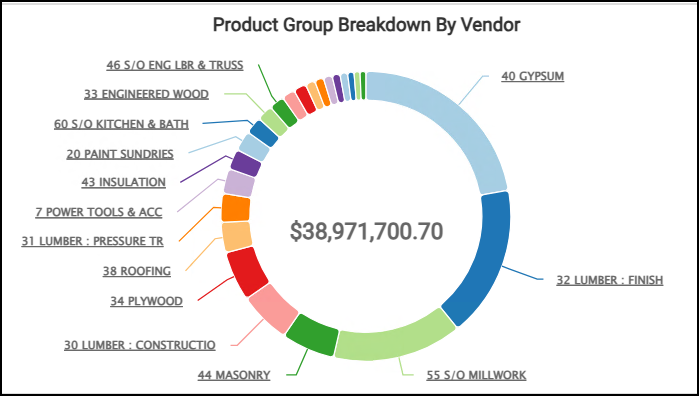
Product Group Breakdown by Vendor > Detail of the Vendor Purchases by Product
It is not only useful to understand the big picture but to break down the data into individual pieces that are actionable at any time. Include trends before tables, to guide attention to insights before providing the details.
Other coaching that may be useful when creating a new dashboard:
-
Limit the number of heavy data widgets in a Dashboard to reduce load time.
-
When developing a Dashboard, test it on the devices that will be used to view the data (laptops and tablets, as needed)
-
Use agreed-upon naming conventions to ensure that everyone understands what each Dashboard is for based on the title.
-
Share Dashboards with stakeholders before finalizing them to gain feedback before you release it.
-
Schedule refreshes or email snapshots when you make changes.
-
If many users have edit privileges for a particular Dashboard, you may want to create version numbers so everyone is clear which Dashboard they are reviewing.
Creating a New Dashboard
When you understand the views and the widgets that you want to use in your Cognytics Dashboards, and you have Dashboard Builder permissions, use the links below to learn how to create, copy, edit, and delete Dashboards on your system.
Customizing your dashboard’s visual design
See Also:
Working with Cognytics Dashboards
Current Dashboard List