Reviewing the Sales User Dashboard (Cognytics)
The Sales User Dashboard features seven widgets that focus on the sales team's current efforts and results. These efforts include new account sales, returns, sales comparisons over time, month-to-date and year-to-date sales data, credit overrides by user (accounts) for the previous month, and the alerts by user for the last 30 days. This dashboard has three filters that determine the settings for the widgets:
-
Date Range (defaults to the previous year)
-
Branches (defaults to All)
-
Users (defaults to All)
This Dashboard is useful for Sales Managers who support the sales team in meeting their targets. It provides a broad and detailed view of sales data for each salesperson, and drill-down features to review account information.
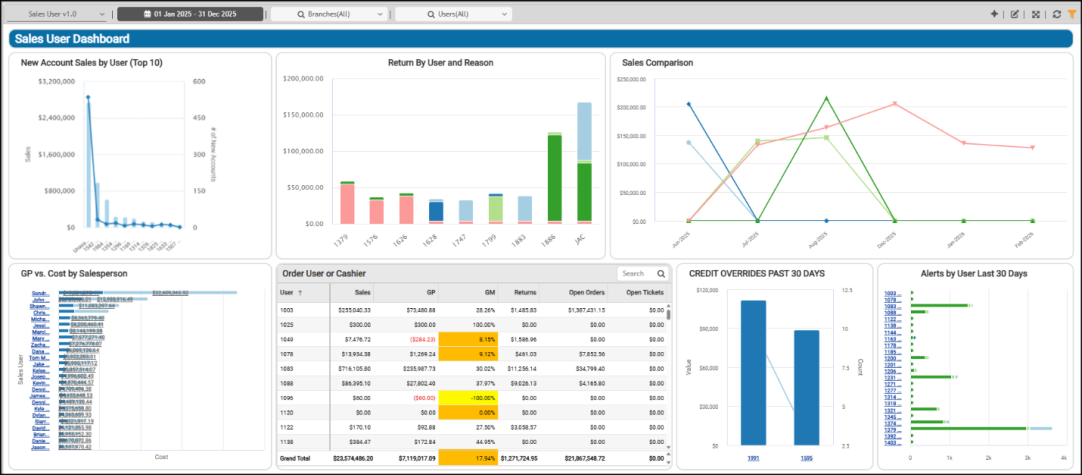
Sales User Dashboard
Alerts by User Last 30 Days Widget (Sales User Dashboard)
Widget Name: Alerts by User Last 30 Days
View Name: COG_VW_AlertbyUserlast30days
Historical: No (Fixed period, the Last 30 Days)
Drill-Down: Yes (By User and Exception Type Code, DocID, Account, Entry Date, Exception Type (Description)
The Alerts by User (Last 30 Days) stacked bar chart widget shows inventory alerts for items with exception codes that have closed over the past 30 days. The user’s ID displays on the left, so you can drill down to the exact transactions and the reason for the alert.
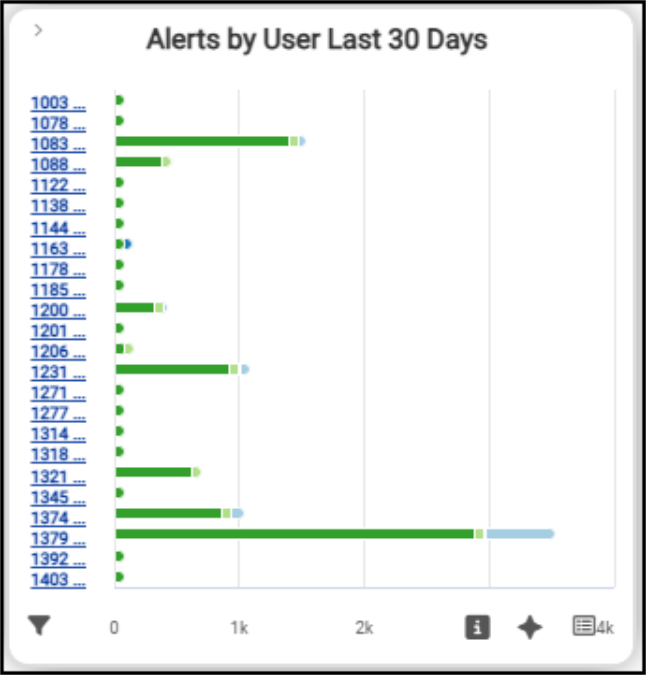
Sales User Dashboard > Alerts by User (Last 30 Days) Widget Chart
The Exception codes that can trigger this alert are defined below:
-
L -Line Discount
Users may be allowed to apply a discount to specific items by entering a percentage in the discount column of the data grid. When this occurs, the discount percentage is shown, and the application sets the exception code to L. Net items also use the discount column and will display an N in place of any discount (net items don't allow line discounts). -
M -Margin Out of LimitsEvery item may optionally be assigned an expected % (margin) and a minimum % (margin). These are located on the Branch (Alt-B) and Pricing (Alt-P) tabs in the Item Maintenance (database) form. When an item's margin falls below the minimum %, it is flagged as a Margin Out of Limits.
-
N -Negative Margin An item has a negative margin when its cost exceeds its selling price. This can happen for several reasons, such as when an item's price is discounted too much or repriced too low. Receiving errors can inflate an item's cost.
-
P -Price Change This exception is set based on the user's actions. If a price is modified either manually or using one of the Reprice (F6) functions, this flag will be set. This allows company or store management to review manual pricing changes.
-
X -More than Two Exceptions Encountered.The column can display up to two exception codes. When three or more codes apply, an "X" displays to indicate that more than two codes are assigned to the transaction. To find the exact exceptions, you can either run the Exceptions report or, when you view the document, you can choose Format > File Copy from the alternate menu to display the transaction details.
-
Z -Zero CostCertain items can have a zero cost for legitimate reasons, such as coupons, credit SKUs, and Comment items; however, most other items should be associated with a cost.
When you click the sales user’s ID link in the left column, the doc ID and transaction details that resulted in the alert display, so you can understand the conditions of the inventory alert.
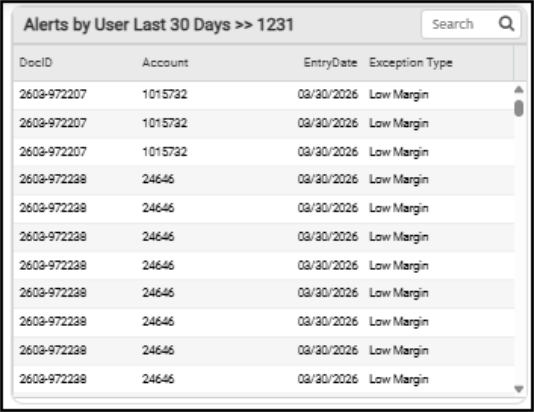
Sales User Dashboard > Alerts by User > User Detail Table
When you review the alerts for the whole table, you see the data sorted by the exception types we described above.
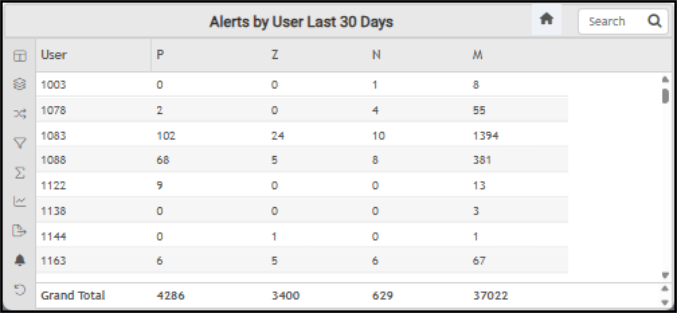
Sales User Dashboard > Alerts by User and by Exception ID
The AI Insights for this widget may display these types of messages:
-
Business Interpretation:
“<User ID> exhibits the highest alert activity, with prominent values for Alert <exception type (highest)> <amount>, <exception type (next highest) <amount>, and <exception type (next highest)> <amount>, and is also among the top for Alert <alert type>. This suggests a significant involvement with alert-triggering processes within the last 30 days.” -
Potential Business Decisions:
“Conduct a focused investigation into the activities of high alert-generating users like <user ID> and <user ID>. The objective is to pinpoint the specific business processes or conditions driving these high alert volumes/values, and to determine if they signify critical issues requiring immediate attention or are part of routine operational procedures. -
Suggested Follow-Up Questions:
“What is the average value for each alert metric <top four alert types> across all users?”
The filters available for this data include account, branch, document IDs, entry user, exception codes, totals, and user ID information.
Credit Overrides Past 30 Days Widget (Sales User Dashboard)
Widget Name: Credit Overrides Past 30 Days
View Name: COG_VW_Creditoverriidespast30days
Historical: No (Fixed, Last 30 Days)
Drill-Down: Yes (Table drill down to Mgr ID, Account, Account Name, Date, Expr (Count), and Sum(Amount))
The Credit Overrides (Past 30 Days) column/bar widget lists the number and total amount of credit overrides for each manager over the last 30 days. This widget uses data from the Credit Overrides and Customer {Master} tables, where the line represents the number of overrides authorized by the user over the last 30 days, and the column represents the override amount.
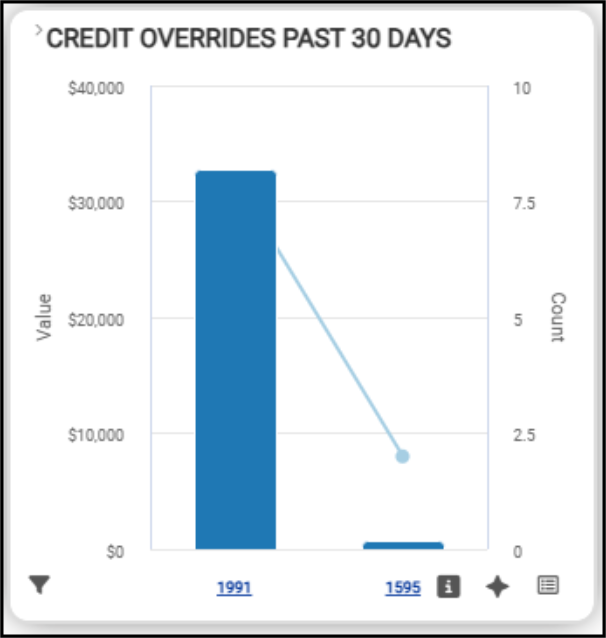
Sales User Dashboard > Credit Overrides (Past 30 Days) Chart
When you click the individual link at the bottom of the widget, the override details display.
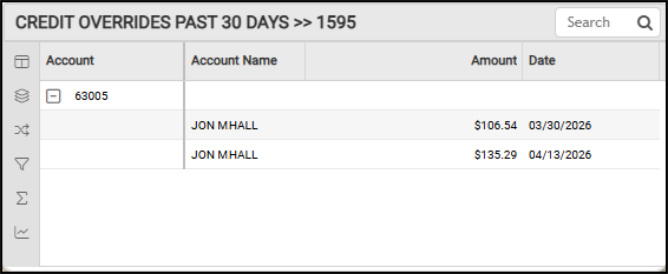
Sales User Dashboard > Credit Overrides Past 30 Days (User ID 1595)
The table view of this data shows the manager’s user ID, the number of incidents, and the total value of the incidents that occurred:
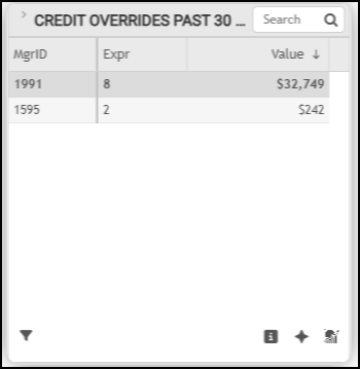
Sales User Dashboard > Credit Overrides Table
The AI Insights records for this widget might include:
-
Business Interpretation:“The average value per override instance for Manager <user ID> is approximately <amount>, significantly higher than Manager <user ID>'s average of <amount>. This suggests Manager <user ID> may be involved in more complex or higher-value credit decisions, or is managing accounts with greater credit limits.“
-
Potential Business Decisions:“Consider whether the current credit management training or approval workflows need adjustments to address the observed disparities in override patterns between managers.”
-
Suggested Follow-Up Questions:“What is the total monetary value of credit overrides attributed to each individual user working under manager <user ID> in the last 30 Days, and what was the total value for each of those accounts?”
You can filter the data in this table by account information, customer class, manager ID, sales representative, dates, user IDs, and override values.
GP vs. Cost by Salesperson Widget (Sales User Dashboard)
Widget Name: MTD YTD Sales By SalesPerson
View Name: COG_VW_MTDYTDSalesbySalesPerson
Historical: Yes
Drill-Down: Table (User, Cost, GP (Gross Profit $))
The Gross Profit vs. Cost of Goods Sold by Salesperson stacked bar widget compares each salesperson’s gross profit and COGS amounts, ordered by profitability. The salesperson’s gross profit amount displays on the left side of their row, and the cost of goods sold appears on the right side.
These values include any returns for the sold items that occurred within the date range, and do not include tax amounts. It includes cashiers for sales that are not associated with a salesperson. This widget does not apply the user’s filter. We modified this table to include salespeople’s names rather than just their user ID.
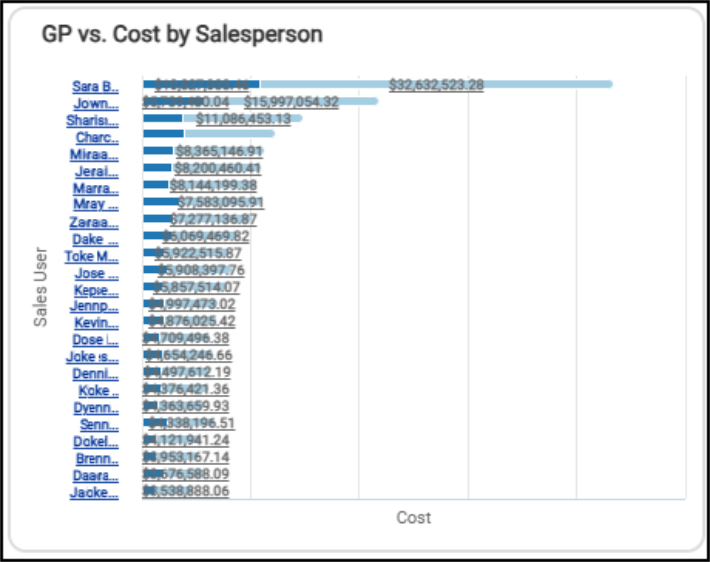
Sales User Dashboard > GP vs. Cost by Salesperson Chart
When you hover over the link on the left side of the column, you see the salesperson’s gross profit amount from their sales.
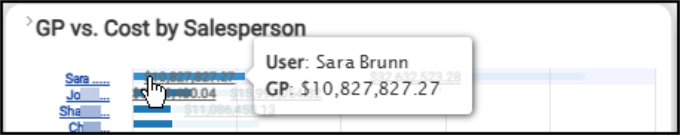
Sales User Dashboard > Gross Profit Amount
When you hover over the link on the right side of the column, you see the salesperson’s cost amount for their sales.
![]()
Sales User Dashboard > Cost Amount
To see this user ID information by Cost and Gross Profit numbers, click the Table option. You can use the Search field to find an individual salesperson’s records by entering the user ID.
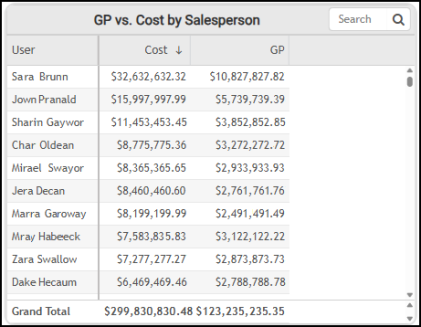
Sales User Dashboard > GP vs. Cost by Salesperson Table
These are some of the AI Insights you might see for this widget:
-
Business Interpretations:
“A key insight reveals varying gross profit efficiencies among salespersons. For instance, <1 salesperson> generated a gross profit of <amount> from a gross cost of <amount>. This is a higher gross profit than <2 salesperson>'s <amount>, despite <1 salesperson> incurring a higher gross cost of <amount>. This suggests that while <1 salesperson> has achieved higher sales volume, <2 salesperson> may be excelling in securing better margins.” -
Potential Business Decisions:
“Conduct a focused analysis on the salespeople who demonstrate strong gross profit margins relative to their sales cost, such as <salesperson>. Understanding their pricing tactics, product recommendations, or negotiation expertise could uncover valuable strategies to enhance overall business profitability.” -
Suggested Follow-Up Questions:
“How has the sales performance, in terms of cost and gross profit, evolved over time for the leading salespersons?”
You can filter this data by account, branch, customer class, entry date, salesperson information, invoice data, tickets, and user ID information.
New Account Sales by User (Top 10) Widget (Sales User Dashboard)
Widget Name: New Account Sales By User v1.0
View Name: COG_VW_NewAccountSales
Historical: No
Drill-Down: None
The New Account Sales by User column bar widget shows the top ten dollar amounts of new sales by the salesperson for the dashboard filter date range. This chart also shows the number of new accounts by user for the same period. The date the new account was established must fall within the selected date range.
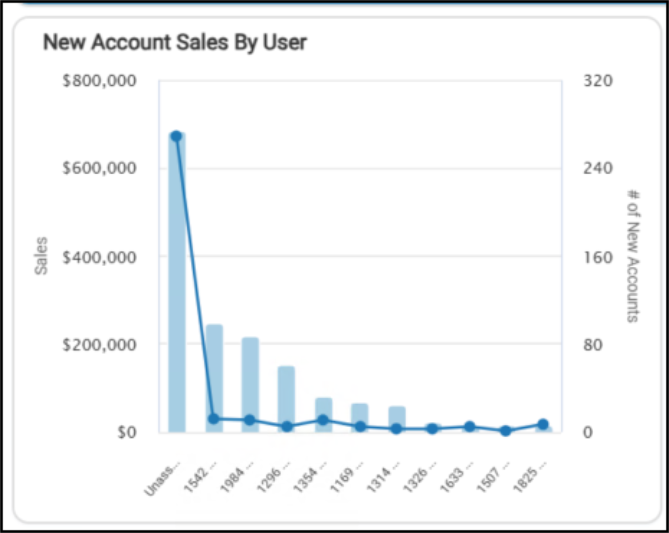
Sales User Dashboard > New Account Sales by User Chart
When you choose the table option, you can see the dollar values and the number of accounts by user directly.
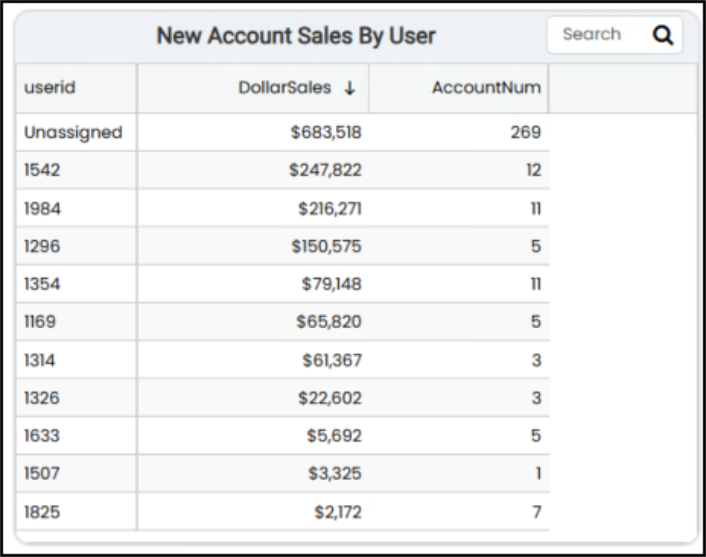
Sales User Dashboard > New Account Sales by User Table
You can filter this data by account data, branch information, customer class, document information, user sales metrics, date (or date range), alert (exception code), extended amount, gross margin, open orders, returns, and by user ID.
Order User or Cashier Widget (Sales User Dashboard)
Widget Name: YTD Sales User ScoreCard v1.0
View Name: COG_VW_YTD SalesUserScoreCard
Historical: No (Current year only)
Drill-Down: Table Listing Open Orders, Returns, etc.
The Order User or Cashier table widget details the sales metrics for each customer-facing salesperson and cashier in the business. The list order defaults to the user ID.
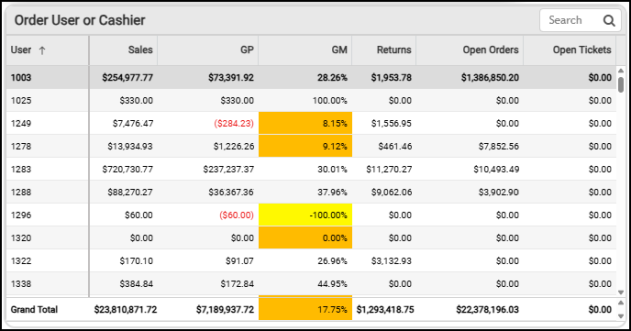
Sales User Dashboard > Order User or Cashier Widget
You can use the Search field to list a single user's metrics. The table includes highlights of thresholds missed or attained. There are AI Insights available for this widget that might include:
-
Business Interpretation:
“High Gross Margin Users with Low Sales: Some users, like <salesperson user IDs> and <salesperson user ID>, display exceptionally high gross margin percentages (<percentages>), but with very low or negligible sales volumes (e.g., <sales user ID> with <amount> in sales). This suggests that while these transactions are highly profitable, their impact on overall business performance is limited due to the small scale.” -
Potential Business Decisions:
“Review Gross Margin for Low-Volume Sales: Investigate instances of extremely high gross margin percentages paired with low sales volumes (e.g., <sales user ID>). Understand if these are genuine high-margin sales that can be scaled or if they represent unique, non-replicable transactions, or potential data entry anomalies.” -
Suggested Follow-Up Questions:
“What is the average gross margin percentage for all sales users, excluding those with zero or negative sales, to establish a realistic performance benchmark?”
You can filter the table entries in this widget using account information, average gross margin statistics, branch, customer class, document, entry date, gross margin, gross profit, open orders, periods, returns, sales, report sums, and user information.
Return by User and Reason Widget (Sales User Dashboard)
Widget Name: Return By User and Reason V2.0
View Name: COG_VW_ReturnByUserReason V1.0
Historical: Yes
Drill-Down: None
The Return by User and Reason stacked column bar widget displays the customer item returns, the ID of the staff member who handled the return, the total return amount associated with the staff member, and the reason code associated with the return. This data comes from the invoice document details, the header tables, and the reason code lookup tables. This widget also counts regular invoice returns and charge returns. This view excludes open tickets and canceled invoices.
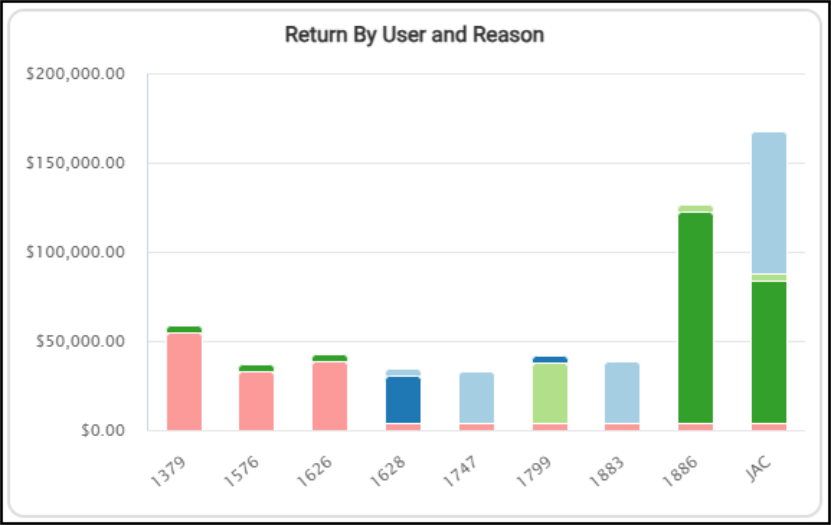
Sales User Dashboard > Return by User and Reason
This information can provide insight into the cost of returns for the date range and the reasons for those returns.
To see the return type, the user ID of the person who accepted the return, and the return amount, hover over the data in the table. The reason codes are set up in your system and appear when you hover over an entry in the list.
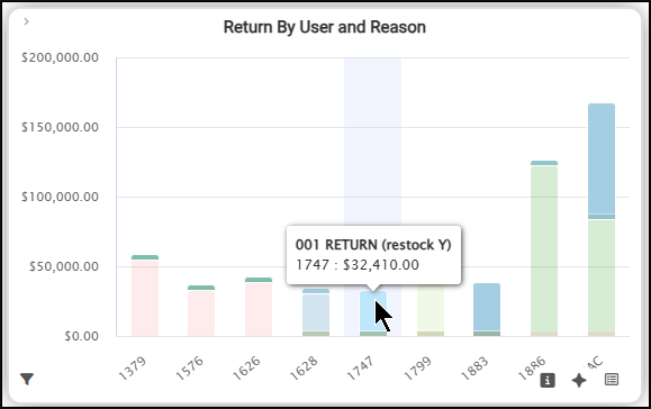
Sales User Dashboard > Return by User and Reason (Detail)
When you switch to the Table version of this widget, you can see additional details, including totals by reason code and the amounts in detail. When the user who processed the return has processed more than one return in the selected date range, each record displays in the same row.
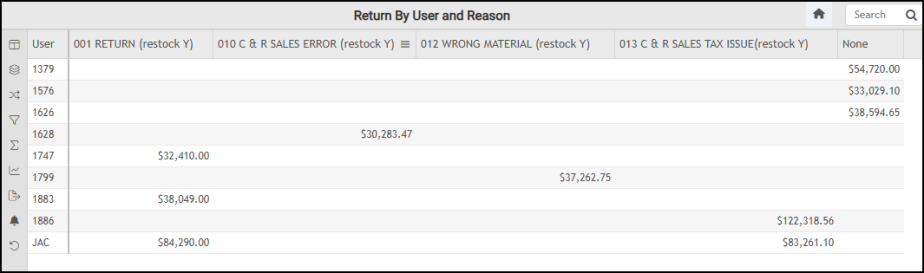
Sales User Dashboard > Return by User and Reason Widget Table
The AI Insights that may be available for this widget include:
-
Business Interpretation:
“The most substantial return category is <return code>, totaling <amount> across all recorded transactions. This category is predominantly influenced by Cashier <user ID> <amount> and <user ID> <amount>, suggesting a concentrated issue related to sales tax handling by these individuals.” -
Potential Business Decisions:
“Examine the operational procedures related to <return reason ID> returns, particularly for transactions handled by Cashier <user ID>. This review should aim to identify and rectify any systemic issues in order processing, inventory picking, or customer order communication.” -
Suggested Follow-Up Questions:
“What is the total return amount for each return reason across the entire business, and how does this change over time?”
When you filter this list, you have many options, including account, branch settings, document ID, user, reason code, date range, extended amount, salesperson IDs, and the sum values of each reason code.
Sales Comparison Widget (Sales User Dashboard)
Widget Name: Sales Comparison V2.0
View Name: COG_VW_UserSalesComparison_V2.0
Historical: No (Fixed Period, Current and Prior 12-months)
Drill-Down: None
The Sales Comparison line graph widget plots the total sales for each order user (or cashier) with invoices over the last 13 months (including the current month).
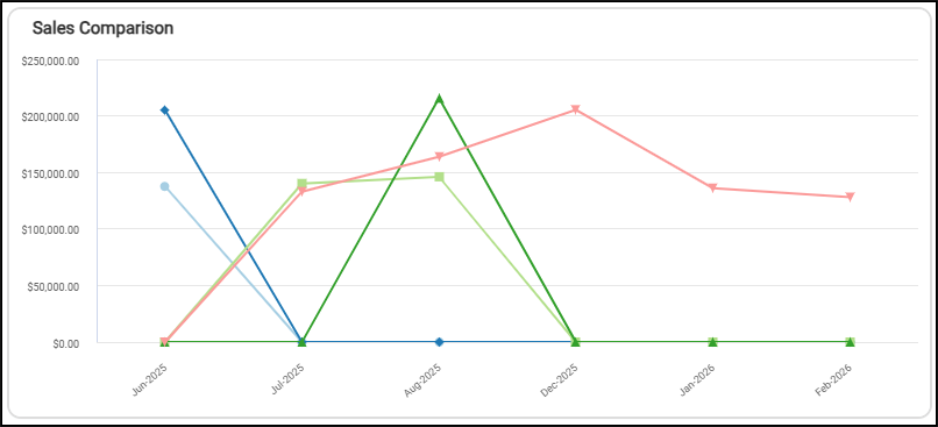
Sales User Dashboard > Sales Comparison Widget
This view is based on the invoice data, does not include tax, but does not deduct item returns. It shows the sales amounts for individual salespeople (by name), month-year, and amount. You can review these values by hovering over a line in the diagram.
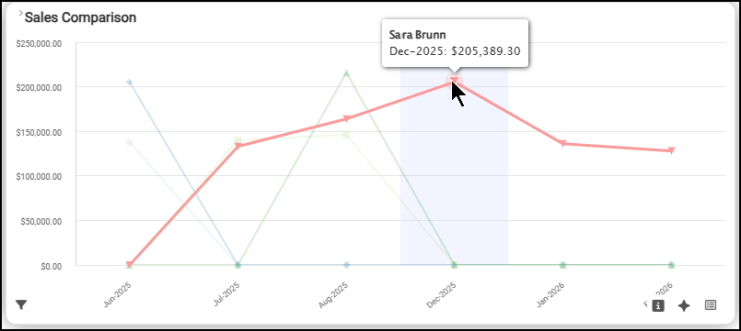
Sales User Dashboard > Sales Comparison Widget (with Salesperson)
To review the details of this widget in table form, choose the Table option. You can use the filters at the top of the Dashboard form to specify a particular user.
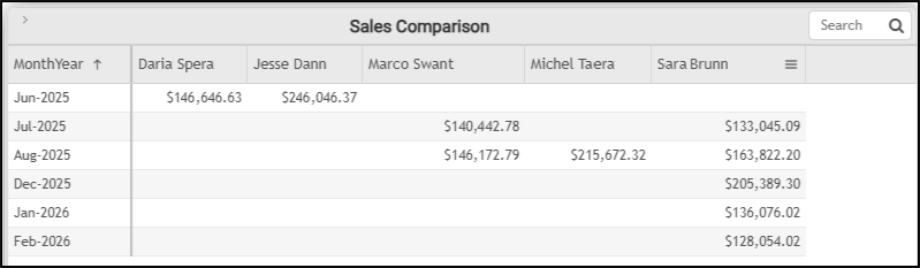
Sales User Dashboard > Sales Comparison Widget Table
There are AI Insights available for this widget, which may be like this:
-
Business Interpretation:
“<User Name> demonstrated consistent sales activity across multiple months, particularly from <month year> to <month year>, with sales ranging from <least amount> to <most amount>. Her <month year> sales of <highest amount> were also a significant peak.” -
Potential Business Decisions:
“Capitalize on Strengths: Investigate the strategies and factors contributing to <user name> exceptional performance in <month year> (and <user name> in <month year>) to identify best practices that could be shared and replicated across the sales team, particularly for other users with zero sales in those respective months.” -
Suggested Follow-Up Questions:
“What is the breakdown of sales by invoice type for <user name> during his peak performance month in <month year>?”
For this widget, you can filter by branch, entry date, invoice type, order user, other sales data, and sales totals.
See Also:
Working with Cognytics Dashboards
Current Dashboard List