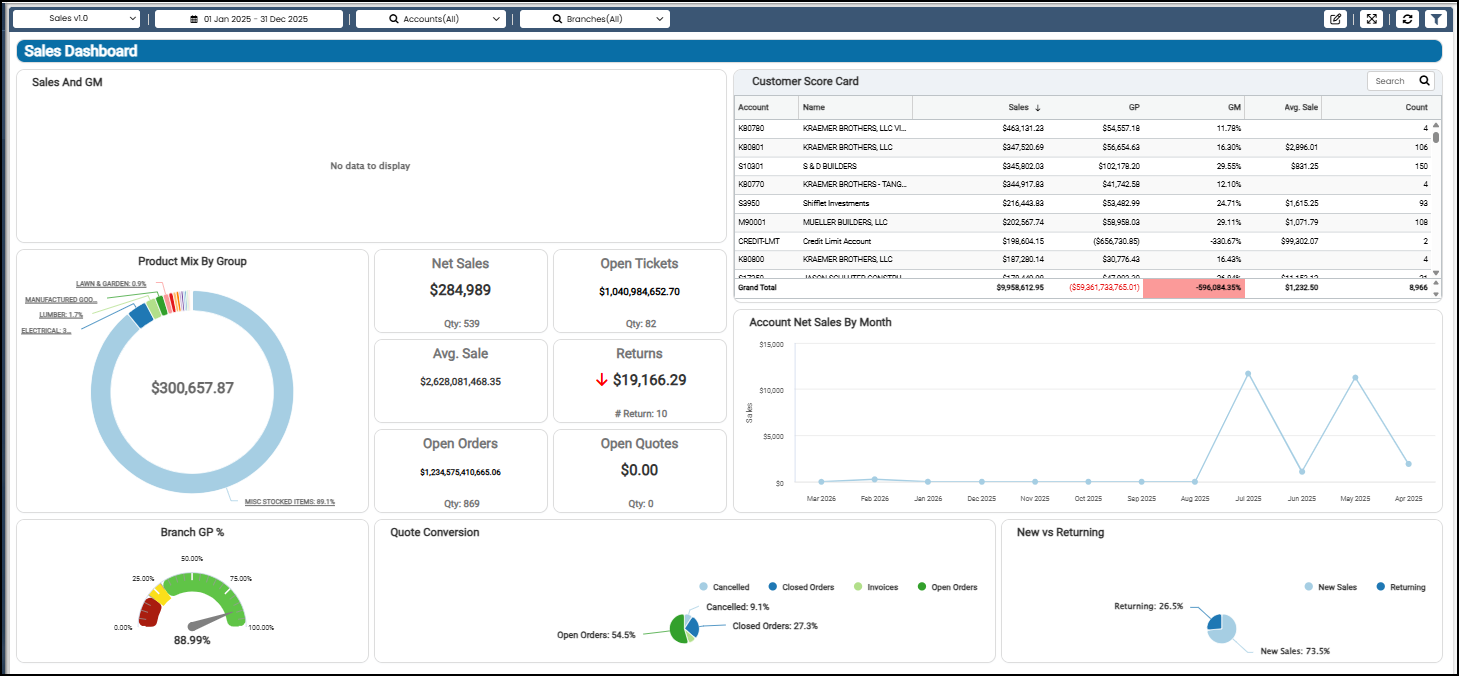
Reviewing the Sales Dashboard (Cognytics)
The Sales Dashboard provides an overview of year-to-date sales activity through 13 widgets from various perspectives. These widgets display sales and gross margin data, including product mix by inventory group, sales, quotes, and orders data, average sales, returns, account net sales by month, branch gross profit, quote conversions, and new versus returning business. By default, this data is organized on a year-to-date basis for all accounts and branches (stores), but you can adjust these settings at the top of the form. The filters in this dashboard include:
-
Date Range (Defaults to Current Year to Date)
-
Accounts (Defaults to All)
-
Branches (Defaults to All)
This information is central to the work of Sales and Account Managers, Store and Branch Managers, and Owners.
Sales Dashboard
Account Net Sales by Month (Year to Date) Widget (Sales Dashboard)
Widget Name: Account Net Sales By Month
View Name: COG_VW_NetSales
Historical: No
Drill-Down: None
The Account Net Sales by Month line chart widget shows the net sales amounts, beginning with the same month of the prior year and including the current month-year. Net sales include cash and charge sales minus any returns and applicable taxes. This table uses the branch totals and the monthly summary values as data sources.
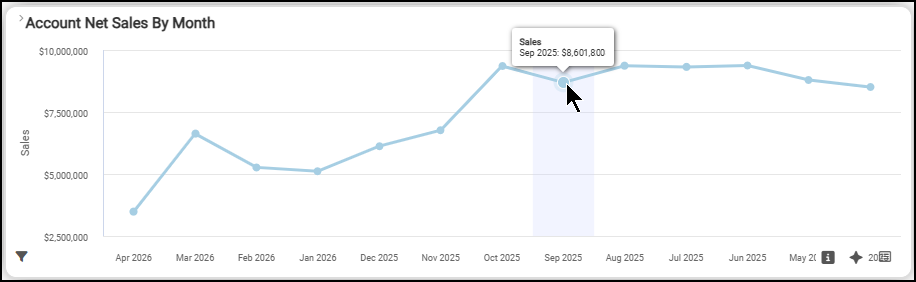
Sales Dashboard > Account Net Sales by Month Chart
The table presents the data numerically and compares the year-to-date grand total with last year’s sales.
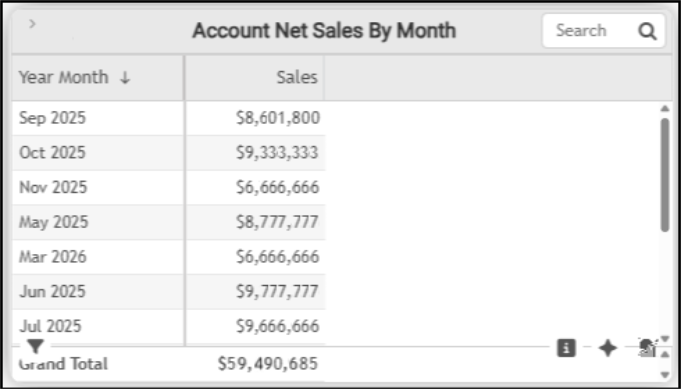
Sales Dashboard > Account Net Sales by Month Table
The AI Insights for this widget might include:
-
Business Interpretation:
“Sales Performance Overview: The provided data shows monthly net sales figures spanning from <next month of prior year>to <current month of current year>, revealing significant fluctuations within this period.” -
Potential Business Decisions:
“Analyze Sales Performance by Branch: To gain a deeper understanding of where sales strengths and weaknesses lie, review the performance of individual branches, especially during both peak and off-peak seasons, to identify best practices or areas needing improvement.” -
Suggested Follow-Up Questions:
“What were the total sales contributions from different payment types, such as cash versus charge sales, during the months with the lowest overall sales?”
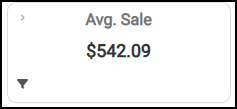
Average Sale Widget (Sales Dashboard)
Widget Name: Avg Sale v1.0
View Name: COG_VW_AvgSale
Historical: Yes
Drill-Down: None
The Average Sale headline widget shows the average sale amount year-to-date based on invoices, and includes all sales (including sales, orders, plus direct ship, and installed sales (for Spruce businesses)) minus returns. This widget also excludes negative sales for yard style and cash tickets, as well as closed or in-progress document transactions.
Sales Dashboard > Average Sale Chart
You can filter this information by account, costs, customer class, name, returns, sales representatives, average sale entry dates, invoices, ticket amounts, and user. You must have administrative permission to review this data in detail.
Branch Gross Profit % Widget (Sales Dashboard)
Widget Name: Branch GP Percent
View Name: COG_VW_BranchGPpercent
Historical: Yes
Drill-Down: None
The Branch Gross Profit Percentage gauge chart is a key financial metric that shows the branch's gross profit for the period, based on the selected filters. Specifically, this is the Gross Profit Percentage calculation:
Gross Profit % = Sum(Cash Sales + Charge Sales – Cash Credits – Charge Credits – Tax - COGS x 100SUM(Cash Sales + Charge Sales -Cash Credits -Charge Credits -Tax)
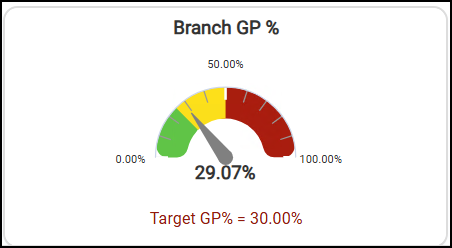
Sales Dashboard > Branch Gross Profit % Chart
The AI Insights for this widget might include:
-
Business Interpretation:
“The overall Gross Profit (GP) for the business stands at <percentage>. This single metric provides a high-level view of the company's profitability from its core sales activities, indicating the margin achieved after accounting for the cost of goods sold.” -
Potential Business Decisions:
“Evaluate this Gross Profit <percentage> against internal targets, historical performance, and industry benchmarks specific to the Lumber and Building Materials sector to determine if it reflects healthy operational margins.” -
Suggested Follow-Up Questions:
“What is the Gross Profit percentage for each individual branch?”
You can filter this data by branch ID, cash and charge sales amounts, tax, and cost of goods sold (COGS). You must have administrative permission to review this data in detail.
Customer Score Card Widget (Sales Dashboard)
Widget Name: Customer Score Card Sales v1.0
View Name: COG_VW_CustomerScoreCardSales
Historical: Yes
Drill-Down: Yes (Additional Customer Details)
The Customer Score Card table widget provides details on gross profit and gross margin for sales by account, year-to-date, ordered by the accounts’ total sales (highest to lowest).
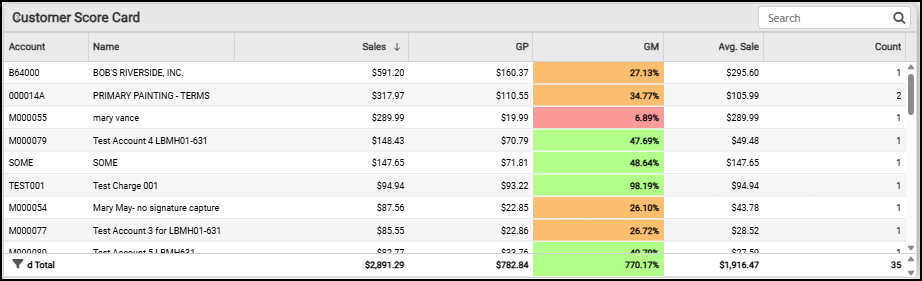
Sales Dashboard > Customer Score Card Table
The color coding for the data in this table is:
-
Green = Gross Margin => 35%
-
Orange = Gross Margin => 30% and <= 34.99%
-
Red = Gross Margin =< 29.99%
You can filter this data using account and customer information, location information (city, address, state code, zip), number of transactions, current balance, date the account was established, dollar costs, dollar sales, dates, finance charges assigned to the transactions, invoices processed, opening balance data, salesperson information, totals, and user data.
New vs. Returning Sales Widget (Sales Dashboard)
Widget Name: New VS Returning v1.0
View Name: COG_VW_NewvsReturning v1.0
Historical: No
Drill-Down: None
The New versus Returning Sales circle widget shows the percentage of total sales that new sales vs. returning sales represent over the dashboard’s date range. That is, accounts with an established date prior to the current date range versus those within the established dashboard date range. This widget excludes cash sales.
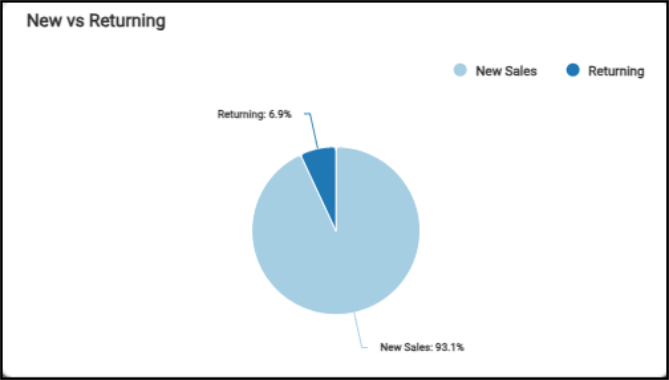
Sales Dashboard > New vs. Returning Chart
The New vs. Returning table reflects the new sales amount and the returning sales amount for the period. The new sales and returning sales account totals display for the date range.
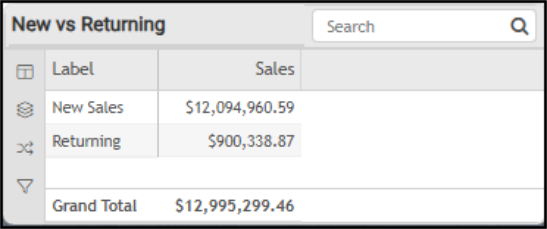
Sales Dashboard > New vs. Returning Table
The AI Insights for this widget might include:
-
Business Interpretation:
“Dominance of <Label>: The <top label> category generated an overwhelmingly large amount of <amount>. This indicates that the primary revenue driver, in the scope of this analysis, is from new customer acquisition or initial purchases by newly established accounts.” -
Potential Business Decisions:
“Investigate <Top Category> Drivers: Analyze the specific factors contributing to the exceptionally high <top category label> amount. Determine if this is driven by a high volume of new accounts, large initial order values from new accounts, specific product lines, or successful acquisitions. Understanding these drivers is crucial for sustaining and replicating this success.” -
Suggested Follow-Up Questions:
“Can we see the monthly count of new accounts established?”
You can filter the data in this widget by amount, category, date established, and total dollar amount.
Net Sales Widget (Sales Dashboard)
Widget Name: Sales v1.0
View Name: COG_VW_Sales
Historical: Yes (with limits to display 29 days at once)
Drill-Down: No
The Net Sales headline widget displays the total sales completed and the quantity of invoices (minus returns) year-to-date (as set in the Dashboard date settings).
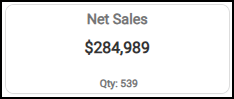
Sales Dashboard > Net Sales Chart
You can filter this data by account, branch, cost, customer class, entry date, invoices, returns, tickets, sales representative, and user.
Open Orders Widget (Sales Dashboard)
Widget Name: Open Orders v1.0
View Name: COG_VW_Open Orders
Historical: Yes
Drill-Down: Yes (Account, Document (Internal ID), Sales ID, Date of Entry, Amount)
The Open Orders headline widget shows the extended amount of open orders currently in progress, as well as the number of orders. These amounts do not include adjustments for remaining quantities or tax amounts. This widget does not consider the date setting, but does reflect the branch and account settings.
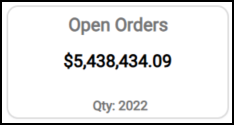
Sales Dashboard > Open Orders Chart
When you click this widget, the table detail displays the account information, the Document ID for the open orders, the salesperson’s user ID, the transaction date, and the order amount. The grand total for these transactions displays at the bottom of the form.
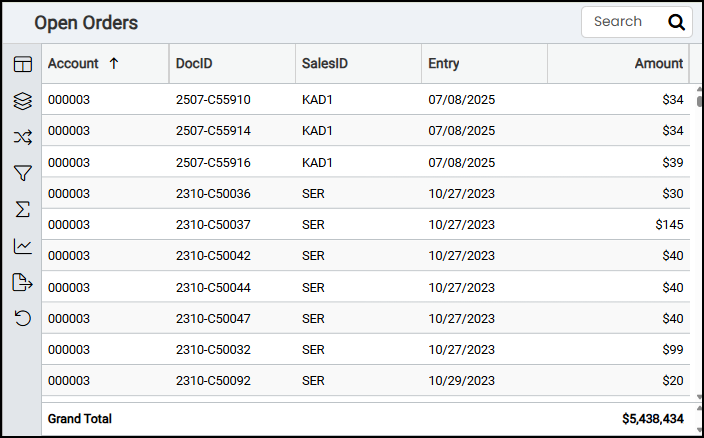
Sales Dashboard > Open Orders Table
You can filter these settings by account, branch, customer class, document IDs (internal and customer-facing), entry and expiration dates, extended amounts, and user records. You must have administrative permission to review this data in detail.
Open Quotes Widget (Sales Dashboard)
Widget Name: Open Quotes
View Name: COG_VW_OpenQuotes
Historical: Yes
Drill-Down: Yes (Account, DocID, Sales ID, Entry Date, Expire Date, Amount.
The Open Quotes headline widget shows the number and extended amounts of open quotes in progress (within the current date range). These amounts do not include sales tax.
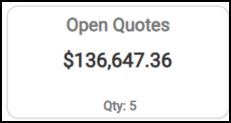
Sales Dashboard > Open Quotes Chart
You can filter this information by account, branch, document IDs (internal and customer-facing), entry and expiration dates, by the quote’s extended amounts, and sales and user information.
Open Tickets Widget (Sales Dashboard)
Widget Name: Advice Notes v1.0
View Name: COG_VW_AdviceNotes
Historical: Yes
Drill-Down: Yes (Account, Document (Internal ID), Sales ID, Date of Entry, Amount)
The Open Tickets (Advice Notes) headline widget shows the number and amount of the tickets processed year-to-date (based on the date range in the dashboard settings). This amount does not include tax.
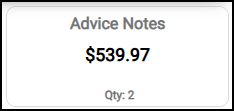
Sales Dashboard > Advice Notes (Tickets) Chart
You can filter this by branch, cost, ticket/note entry date, invoices, and returns.
Product Mix by Group Widget (Sales Dashboard)
Widget Name: Product Mix By Group v1.0
View Name: COG_VW_ProductMixSales
Historical: Yes
Drill-Down: Yes (Lists by Group/Section description, then gross margin percentage)
The Product Mix by Group donut chart lists the product groups with the total sales percentage and the total sales for all products in the middle, based on the dashboard filter settings. The data is based on the invoice tables (including the header and details), group and section tables, customer {master} table, and relevant document tables.
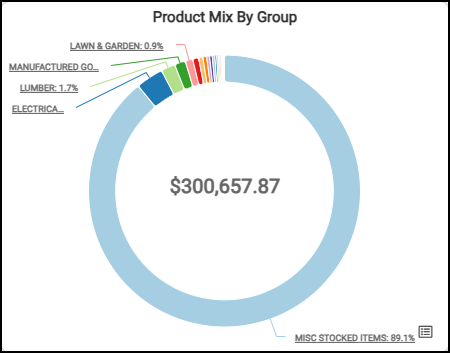
Sales Dashboard > Product Mix by Group Chart
The table lists the groups and sections in order (from highest to lowest) and shows the grand total for all groups and sections.
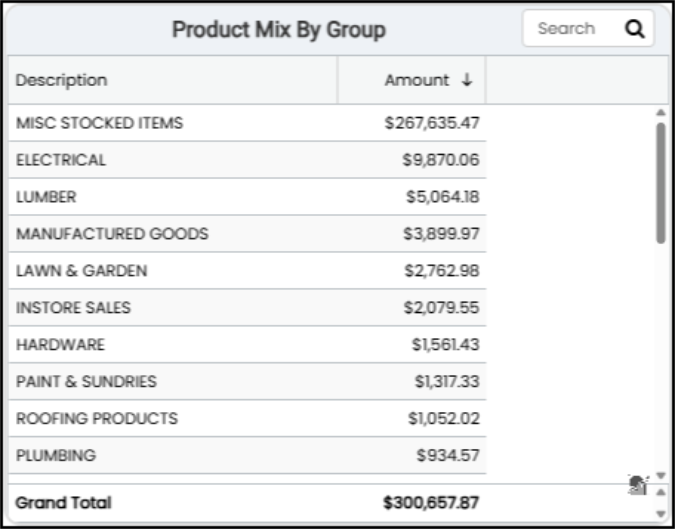
Sales Dashboard > Product Mix by Group Table
The AI Insights for this widget might include:
-
Business Interpretation:
“<Product description> is the dominant category, generating an impressive <amount> in sales. This critical insight highlights its central role in the overall product mix. <Second product description> stands as the second-highest contributor with <amount>, reinforcing the importance of special order and <product group> products.” -
Potential Business Decisions:
“Conduct a deeper analysis into the profitability of <product description> items. If these categories yield higher margins, consider investing in expanding custom order capabilities, streamlining the order-to-delivery process, and increasing their visibility in marketing efforts.” -
Suggested Follow-Up Questions:
“Consider what are the gross margins associated with each of these product groups to understand their true profitability.”
This table can be filtered by account/customer information, branch, sales representative and cashier, group and section information, costs, invoice types, and user information.
Quote Conversion Widget (Sales Dashboard)
Widget Name: Quote Conversion V1.0
View Name: COG_VW_QuoteConversion
Historical: No
Drill-Down: None
The Quote Conversion circle widget shows the percentage of quote documents that were cancelled, remained as open orders, remained as quotes, and the percentage of quotes converted to sales or orders year-to-date.
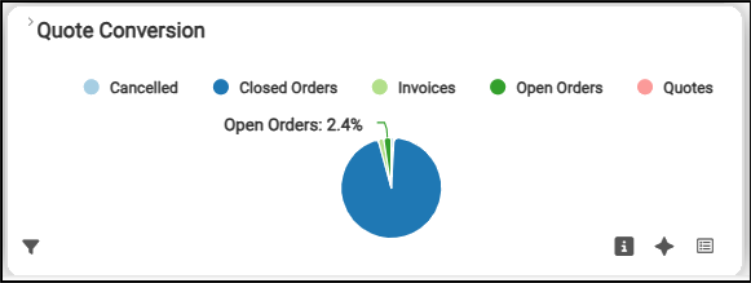
Sales Dashboard > Quote Conversion Chart
The Quote Conversion table reflects the quantities of each quote that were cancelled, closed as orders, converted to sales, that remained open orders, and that were still quotes. The total reflects the number of quotes initiated during the date range.
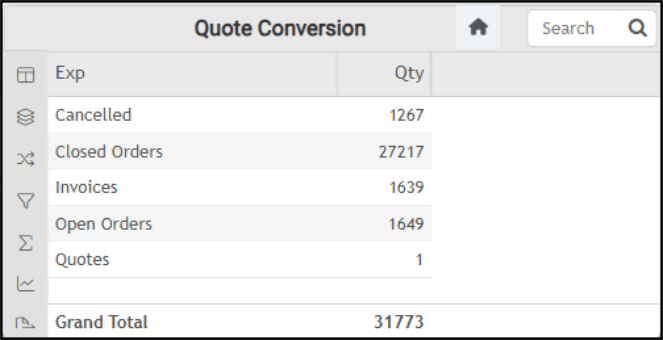
Sales Dashboard > Quote Conversion Table
The AI Insights for this widget might include:
-
Business Interpretation:
“The data clearly shows that <Top Exps> represent the overwhelming majority of activity, with a substantial count of <count number>. This indicates a strong operational capability in finalizing sales or fulfilling order commitments within the system.” -
Potential Business Decisions:
“Analyze Success Factors of <Top Exp>: Conduct a detailed review of the processes, sales strategies, and customer segments associated with the high volume of <top exp entry>. The goal is to identify best practices that can be formalized and replicated across the organization to sustain or further enhance this success.” -
Suggested Follow-Up Questions:
“Can we analyze the performance of the <top exp entry> by individual sales representative or entry user to identify the top performers?”
The filter options for this widget include branch information, document status and type, quote entry date, and quantity information.
Returns Widget (Sales Dashboard)
Widget Name: Returns v1.0
View Name: COG_VW_Returns
Historical: Yes
Drill-Down: No
The Returns headline widget displays the return cost and the number of items returned year-to-date, based on the Dashboard date settings. It also indicates whether the number and amount of the returns have increased (up arrow) or decreased (down arrow) over time. This list includes invoices with yard and cash ticket returns, as well as Charge Returns.
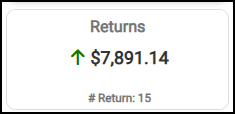
Sales Dashboard > Returns Chart
You can filter this list by account, customer, and branch information, item number and descriptions, document IDs (internal and customer-facing), entry date, invoice type, return amounts, and sales and user information.
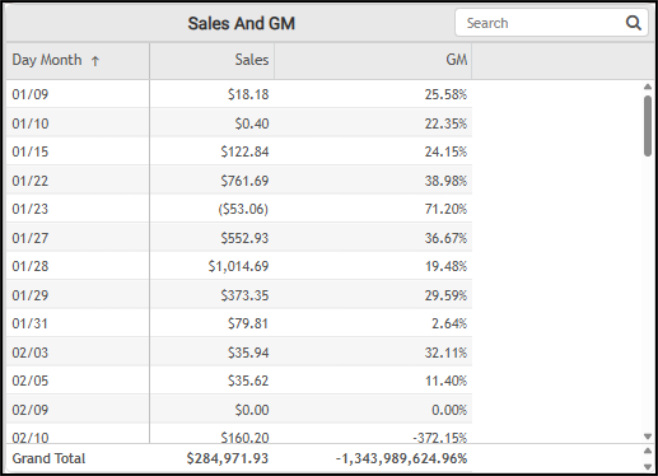
Sales and Gross Margin Widget (Sales Dashboard)
Widget Name: Sales and GM v1.0
View Name: COG_VW_Sales
Historical: Yes (with limits to display 29 days at once)
Drill-Down: Table
The Sales and Gross Margin column/bar widget shows the daily sales for the last 25 business days and the business’s gross margin percentages for each day. These values use the invoice header and document data for sales, direct shipments, and installed sales (when applicable) to calculate the totals. These amounts do not include taxes or returns, nor do they include open tickets or canceled invoices. We include the cost corrections that were applied to sales and returns when calculating the gross margin.
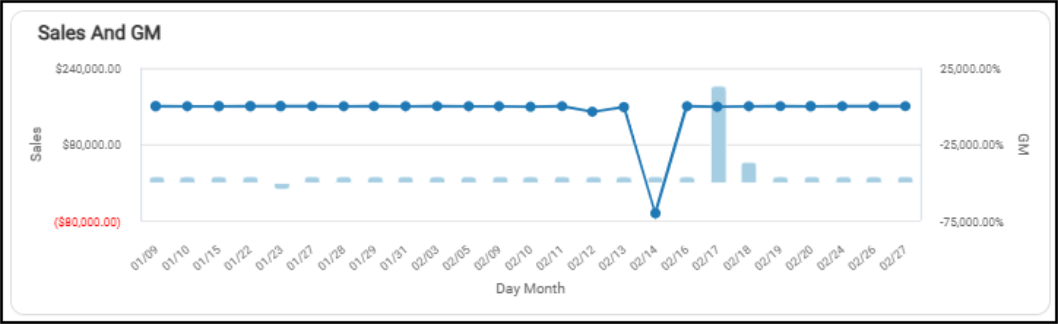
Sales Dashboard > Sales and Gross Margin Chart
When you display the table version of this data, you also see the year-to-date grand total.
Sales Dashboard > Sales and Gross Margin Table
You can filter this data by branch information, costs, day and month information, costs, customer entry date, invoices, returns, target gross margin, and open ticket (advice notes) data.
See Also:
Working with Cognytics Dashboards
Current Dashboard List