Reviewing the Purchasing Dashboard (Cognytics)
The Purchasing Dashboard contains nine Widgets that display information built from your inventory, financial, and inventory receiving data in the application. Once you are familiar with these Widgets, you can filter and customize them to create your own set of resources that include the inventory you have purchased, with an overview and details. The filters in this dashboard include:
-
Date Range (Defaults to Current Year)
-
Vendor Name (Defaults to All)
-
Product Group (Defaults to All)
-
Branches (Defaults to All)
This dashboard is most useful to Purchasing and Inventory Managers, who are responsible for managing the cost of goods. Originally, many of the widgets relied on purchase order data to collect purchase information for vendors. However, a purchase order can be created and never processed. Instead, we use the inventory receipts for metrics, which have a data structure very similar to purchase orders but better reflect deliveries rather than purchases.
Purchasing Dashboard
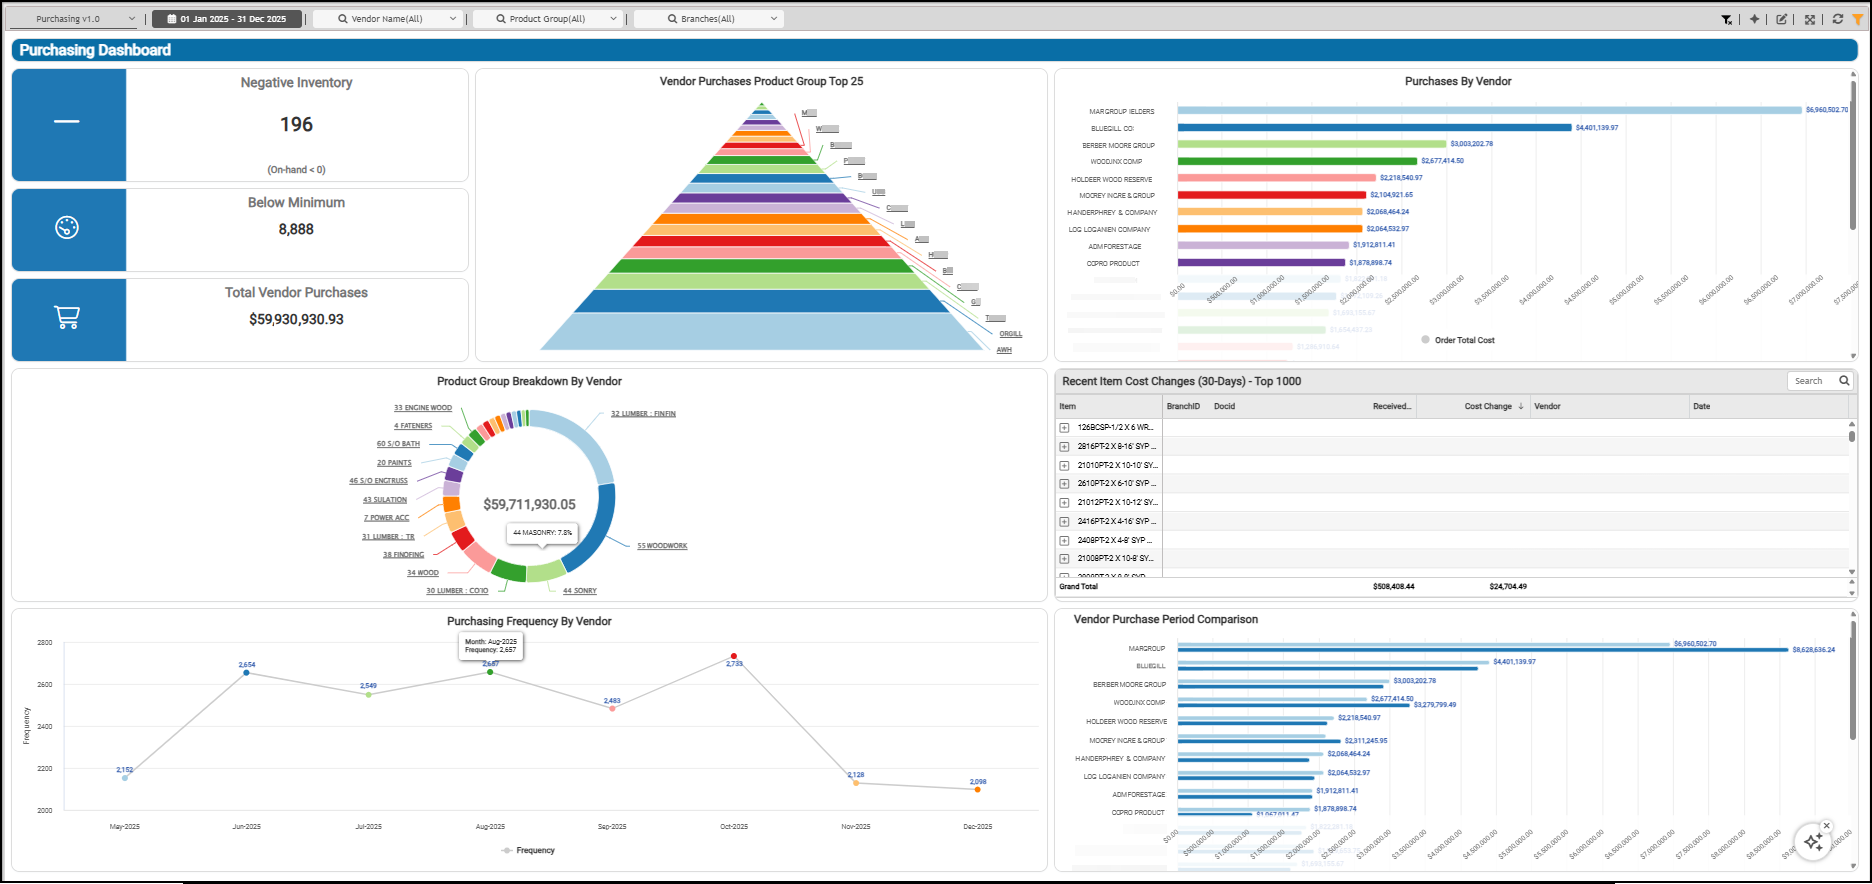
Below Minimum Widget (Purchasing Dashboard)
Widget Name: Below Minimum v1.0
View Name: COG_VW_BelowMin
Historical: No (Current only)
Drill-Down: Yes (Primary Vendor and Item)
The Below Minimum headline widget indicates the count (number) of stocked products where the available quantity ((Onhand + OnOrder) - Committed) is below the Minimum Qty entry in the product’s Item Maintenance form. This widget excludes items for which the business does not maintain receipts or that are either disabled or discontinued.
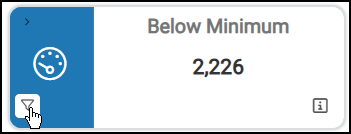
Purchasing Dashboard > Below Minimum > Widget View
When you click this widget, the list of primary vendor codes displays, and when you expand the item details, the below-minimum item data is revealed. For each item, you can review the current on-hand quantity, on-order quantity, committed quantity, minimum quantity, maximum quantity, suggested quantity, and order multiples.
Purchasing Dashboard > Items Below Minimum Table
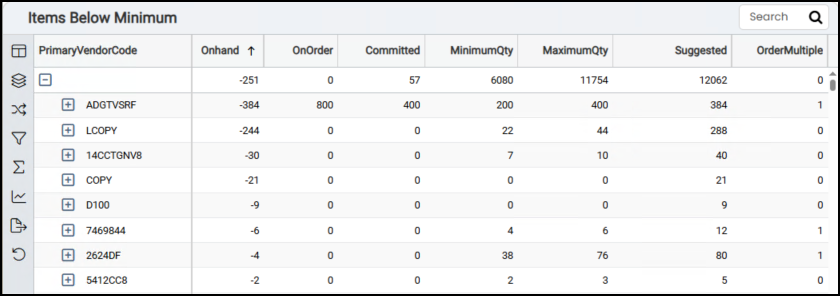
Negative Inventory (On Hand <0) Widget (Purchasing Dashboard)
Widget Name: Negative Inventory (On Hand < 0)
View Name: COG_VW_Negativestock
Historical: No (Current Only)
Drill-Down: Yes (Item, Description, On-hand, On-Order, Committed, Average Cost)
The Negative Inventory (On Hand < 0) headline widget shows the inventory items with negative on-hand quantities and provides the item-level details of those item quantities. The chart shows the number of items with negative quantities.
Purchasing Dashboard > Negative Inventory Chart
Product Group Breakdown by Vendor (YTD) Widget (Purchasing Dashboard)
Widget Name: Product Group Breakdown by Vendor v1.0 Donut
View Name: COG_VW_ProductGroupBreakdownbyVendor
Historical: Yes
Drill-Down: Yes (Vendor Code - Total Order Costs) and Table
The Product Group Breakdown by Vendor donut widget displays product groups as a percentage of the overall inventory and lets you drill down to view the purchasing details for each product group. In the chart, you can hover over the individual groups to see the percentage of the total inventory that group represents. You see the amount of the purchased items for each product group during the reporting period.
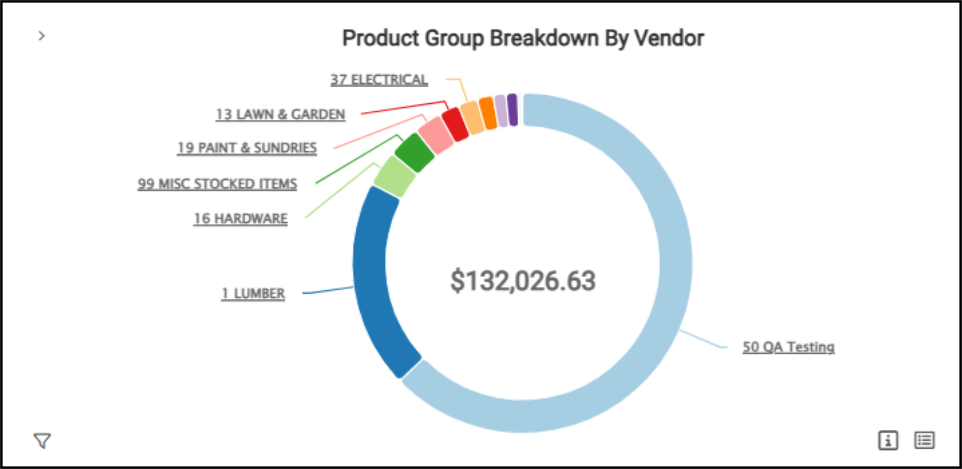
Cognytics > Purchasing Dashboard > Product Group Breakdown by Vendor
When you click a product group link in the donut chart, a detailed list of related product vendors displays, showing the total purchase amount for the group.
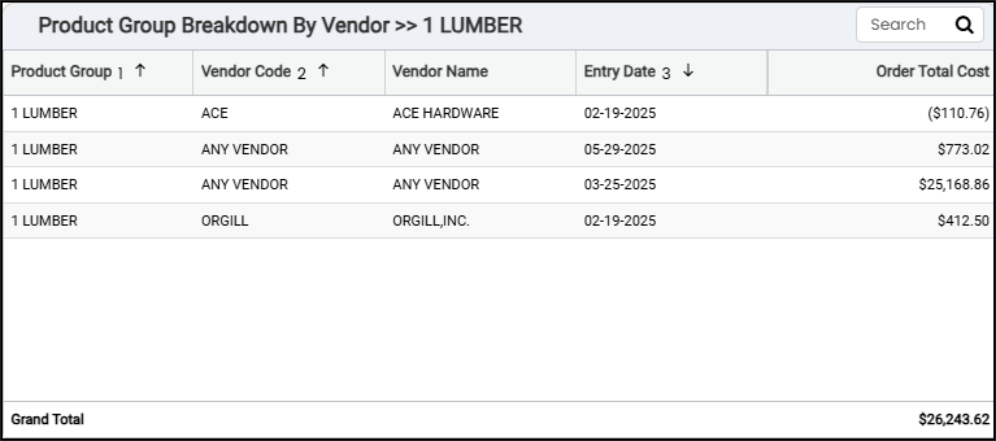
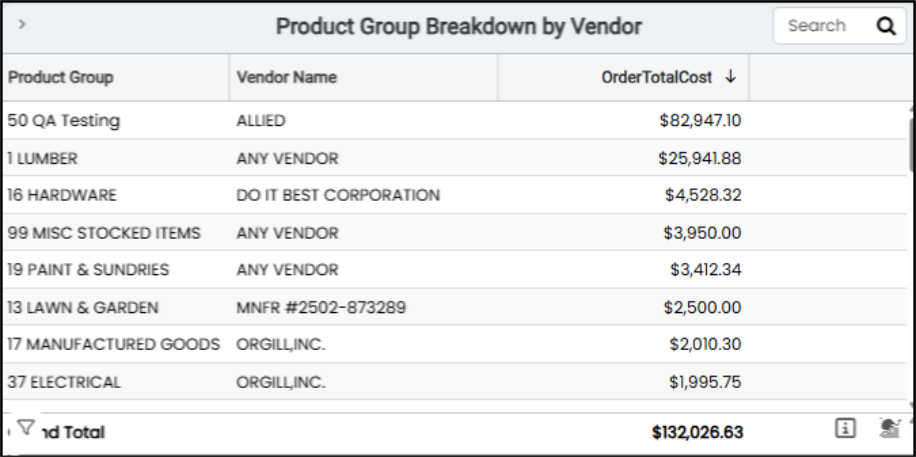
Product Group Breakdown by Vendor Detail Table
When you display the Product Group Breakdown by Vendor information as a table, you can review the total order costs (year-to-date) for all vendor purchases by product group, and the grand total of all product costs.
Purchasing Dashboard > Product Group Breakdown by Vendor Table
The AI Insights for this widget might include:
-
Business Interpretation:
“Key Insights & Trends: There is a pronounced Pareto effect in procurement spending. The top two product groups, <product group> and <product group>, collectively account for over <amount> in order costs, representing a substantial majority of the expenditure captured in this dataset. Following these leaders, there is a steep decline in cost, with the third-ranked group, <product group>, at less than <percent> of the cost of <product group>. This distribution highlights that a small number of product categories drive the bulk of procurement costs.” -
Potential Business Decisions:
“Inventory Performance Analysis: Given the significant capital tied up in the top product groups, it is crucial to analyze their inventory turnover and gross margin return on inventory (GMROI). This will ensure that this high level of procurement spending is translating effectively into profitable sales and not leading to overstocked or obsolete inventory.” -
Suggested Follow-Up Questions:
”What is the yearly trend of order costs for our top five product groups?”
Purchases by Vendor (YTD) Widget (Purchasing Dashboard)
Widget Name: Purchases by Vendor v1.0
View Name: COG_VW_Purchasebyvendor
Historical: Yes
Drill-Down: Table (Vendor Name - Order Total Cost)
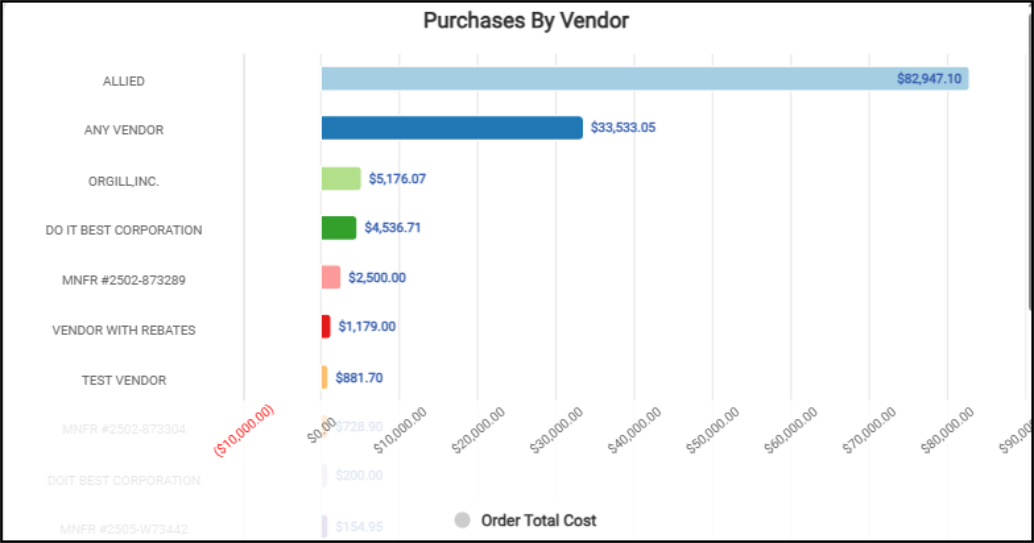
The Purchases by Vendor (YTD) horizontal bar chart lists total purchases, based on inventory receipts, in descending order by period. The dashboard date filters initially set the period. When you select a vendor in the chart, the other widgets on the dashboard update to reflect the selected vendor. Use the Clear Clickable Features option to clear any selections you make in the widget.
This widget shows the total cost by order date for inventory purchased from each vendor, year-to-date.
When you click the table option for this widget, a specific vendor in the list, the other widgets in the dashboard update to show the data relevant to that vendor.
Purchasing Dashboard > Purchases By Vendor Chart
You can drill down to review the amounts of each order for a particular vendor and the vendor's total year-to-date. The Purchases by Vendor table list shows the purchasing totals by vendor (year-to-date) and the total of inventory purchases.
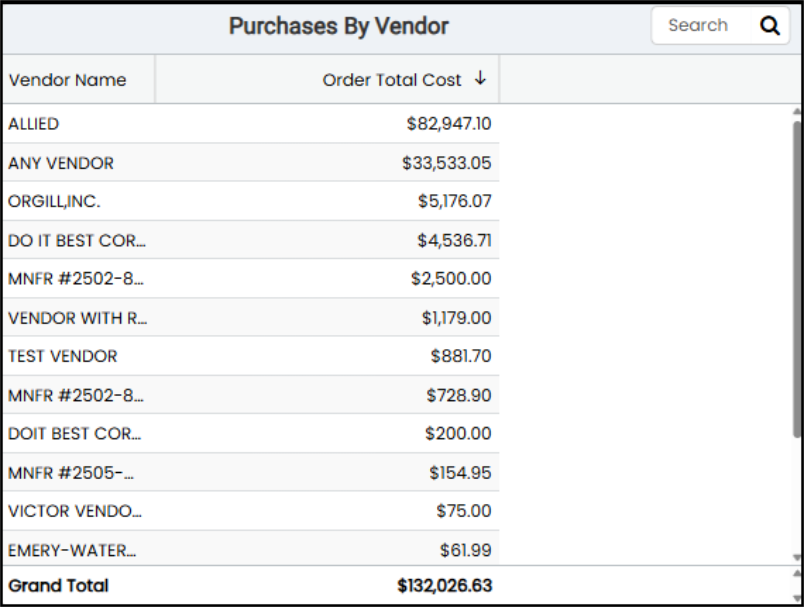
Purchasing Dashboard > Purchases by Vendor Table
The AI Insights for this widget might include:
-
Business Interpretation:
“High-Value Supplier Concentration: The data reveals a significant concentration of expenditure with a few key vendors. <Vendor 1> is the top supplier with a total purchase cost of <amount>, which is over <percentage> higher than the second-largest vendor, <vendor 2> at <amount>. The top three vendors (<vendor 1>, <vendor 2>, and <vendor 3>) collectively account for over <amount> in total purchase costs.” -
Potential Business Decisions:
"Strengthen Strategic Partnerships: For the top-tier vendors like <vendor 1> and <vendor 2>, leverage this high volume of business to negotiate more favorable terms. This could include volume rebates, improved pricing tiers, priority fulfillment, or extended payment terms to enhance profitability and supply chain reliability.” -
Suggested Follow-Up Questions:
”How has our spending with top vendors like <vendor 1> and <vendor 2> changed over time, on a monthly or yearly basis?”
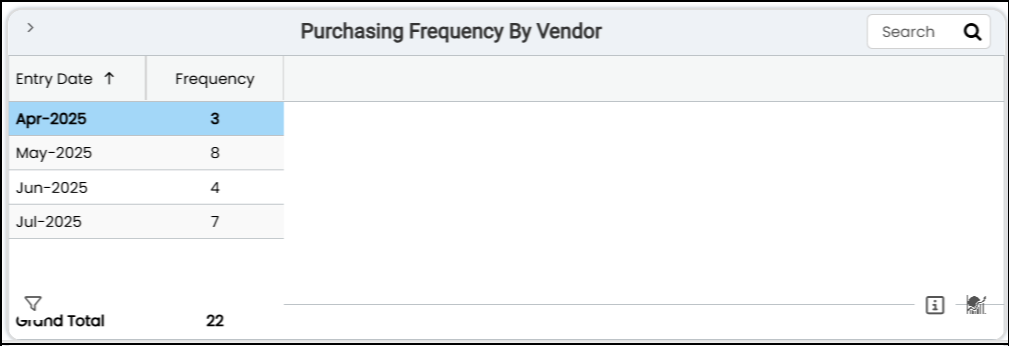
Purchasing Frequency by Vendor Widget (Purchasing Dashboard)
Widget Name: Purchasing Frequency by Vendor 1.0
View Name: COG_VW_PurchasingFrequencybyVendor
Historical: Yes
Drill-Down: Table (Month Number, Frequency)
The Purchasing Frequency by Vendor line graph shows the number of vendor receipts completed for the current month (year-to-date).
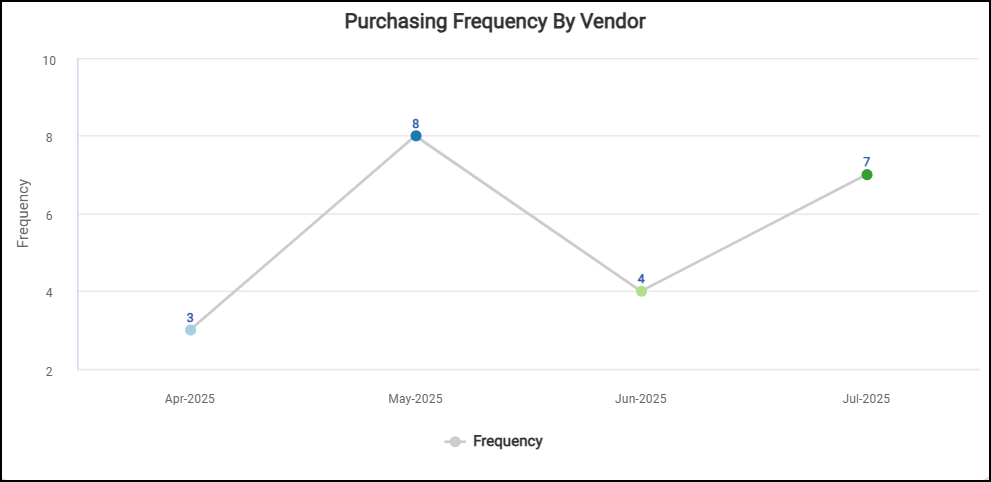
Purchasing Dashboard > Purchasing Frequency by Vendor Chart
You can filter the information collected for this widget by branch, entry date, order receipt frequency, and vendor information (name and code). You must have administrative permission to review this data in detail.
Purchasing Dashboard > Purchasing Frequency by Vendor Chart
The AI Insights for this widget might include:
-
Business Interpretation:
“Peak Purchasing Period: The data indicates a significant increase in purchasing activity during the late summer and early fall, peaking in <month year> with a total frequency value of <amount>. The months of <month> through <month> consistently show the highest purchasing volumes, all exceeding <amount>..” -
Potential Business Decisions:
“Strategic Supplier Negotiations: Leverage the high-volume purchasing period from <month> to <month> to negotiate more favorable terms, volume discounts, or rebates with key suppliers, as this is when your purchasing power is at its peak.” -
Suggested Follow-Up Questions:
”Which specific vendors contributed the most to our peak purchasing activity in <month>?”
Recent Items with Unit Cost Changes Widget (Purchasing Dashboard)
Widget Name: Items with Unit Cost Changes
View Name: COG_VW_ItemswithUnitCostChanges
Historical: Yes (with limits to data within the past year)
Drill-Down: Item Details with Costs, Vendor, Doc ID, and Dates
The Recent Items with Unit Cost Changes table widget lists items with one or more purchase orders whose received items have unit cost (cost UM) changes between the current receipt and prior receipt for the same branch (current year-to-date).
You can expand each item to review its purchase order document ID, cost, vendor name, and the transaction date.
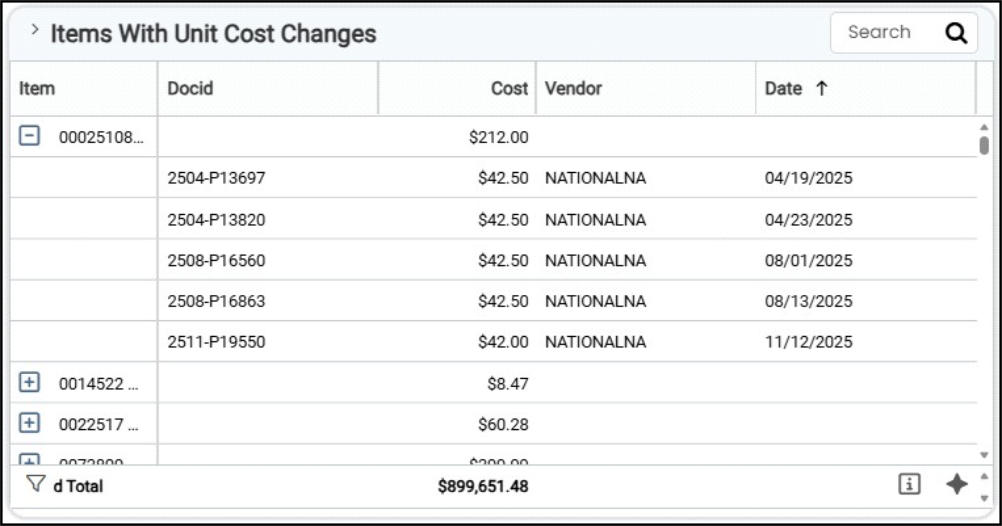
Purchasing Dashboard > Items with Unit Cost Changes Table
You can expand the item notes to view the cost details by purchase order, including the document ID, unit cost, vendor code, and date. The Grand Total reflects the sum of the receipt cost difference in the last 12 months.
You can filter the information in this table by branch, cost, vendor, item receipt date, document ID date, item details, and vendor information.
The AI Insights for this widget might include:
-
Business Interpretation:
“The analysis highlights significant and recent cost increases across a variety of inventory items, primarily within lumber and building materials. The most substantial cost change was for item <item description>, which saw an increase of <amount>.” -
Potential Business Decisions:
"Proactive Customer Communication: For high-volume items with large price swings, consider proactively communicating with key contractor accounts. This transparency can help manage expectations for upcoming quotes and orders, preserving crucial business relationships." -
Suggested Follow-Up Questions:
”Which vendors are associated with the largest total cost increases recently?”
Total Vendor Purchases (YTD) Widget (Purchasing Dashboard)
Widget Name: Total Vendor Purchases
View Name: COG_VW_Purchasebyvendor
Historical: Yes
Drill-Down: No
The Total Vendor Purchases widget displays the total inventory purchases (based on receipts) year-to-date.
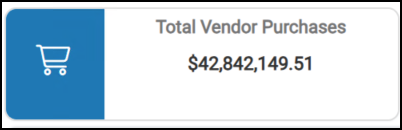
Purchasing Dashboard > Total Vendor Purchases
You can use filters to display this information by branch ID, order date, and cost, and by vendor information (including vendor ID and name).
Vendor Purchase Period Comparison Widget (Purchasing Dashboard)
Widget Name: Purchases by Vendor v1.0 Second
View Name: COG_VW_Purchasebyvendor
Historical: Yes
Drill-Down: Yes (Group Description, Order Total, Vendor)
The Vendor Purchase Period Comparison bar chart shows the current and prior total costs for each vendor. It also shows the grand total of the current and prior costs.
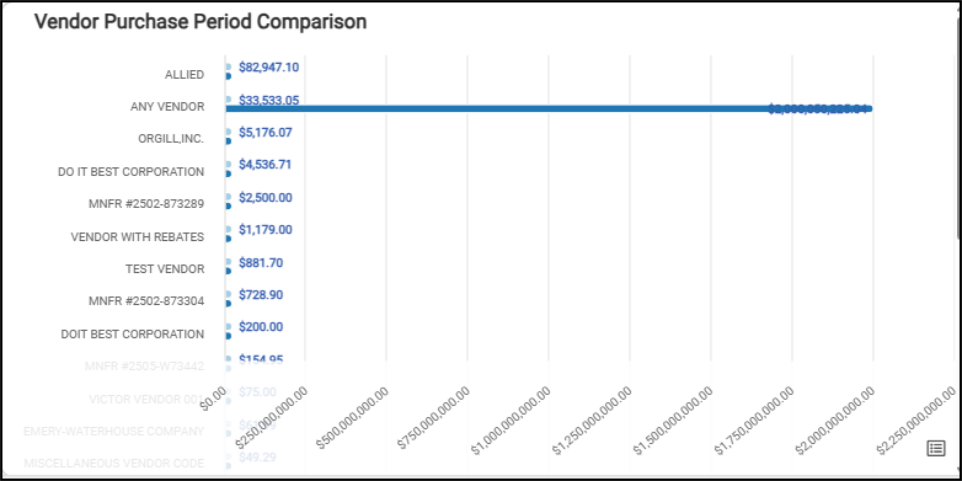
Purchasing Dashboard > Vendor Purchase Period Comparison
When you review the table version of this chart, you can see the current and prior total costs for all listed vendors. This data can be filtered by branch, order date, order total cost, vendor code, and vendor name.
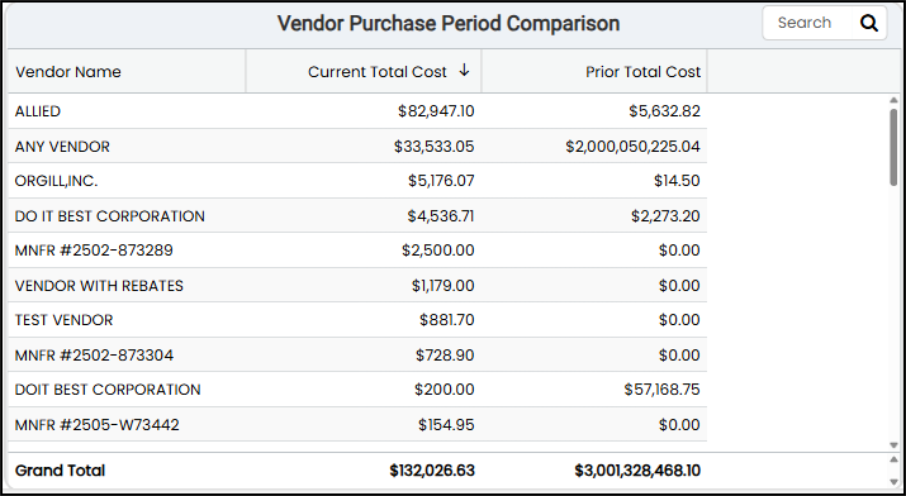
Purchasing Dashboard > Vendor Purchase Period Comparison Table
The AI Insights for this widget might include:
-
Business Interpretation:
“Stable High-Volume Partners: Vendors like <vendor 1> (<amount range>) and <vendor 2> (<amount range>) demonstrate stable, high-volume purchasing relationships, indicating consistent reliance and partnership.” -
Potential Business Decisions:
"Investigate Major Spend Reduction: Engage with procurement and sales teams to understand the <amount> spending decrease with <vendor name>. Determine if this was a strategic decision to diversify suppliers, a result of their price increases, availability issues, or a drop in demand for their specific product lines. This analysis is critical to ensure supply chain stability and margin protection." -
Suggested Follow-Up Questions:
”Which vendor branches are driving the significant increase in purchases from <vendor>?”
Vendor Purchases by Product Group (Top 25) Widget (Purchasing Dashboard)
Widget Name: Vendor Purchases by Product Group v1.0
View Name: COG_VW_VendorpurchasebyProductgroup
Historical: Yes
Drill-Down: Yes (Group Description, Order Total, Vendor)
The Vendor Purchases by Product Group pyramid widget displays the top 25 vendors from whom you have received purchased products.
The detailed list allows you to drill down into total order costs for each vendor within the product group, by vendor code.
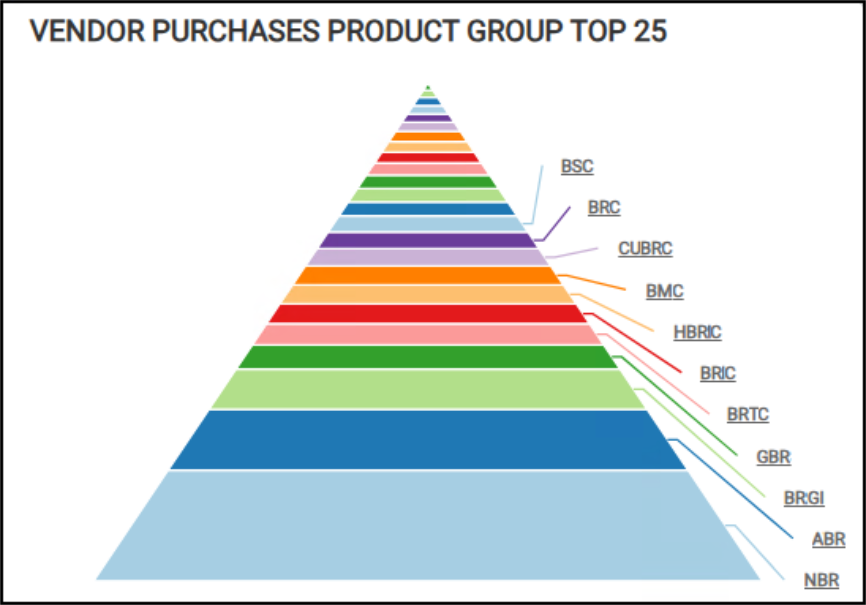
Purchasing Dashboard > Vendor Purchases by Product Group (Top 25)
When you click the link (row) in the chart, you can review vendor purchases (based on product receipts) by product group, including the grand total.
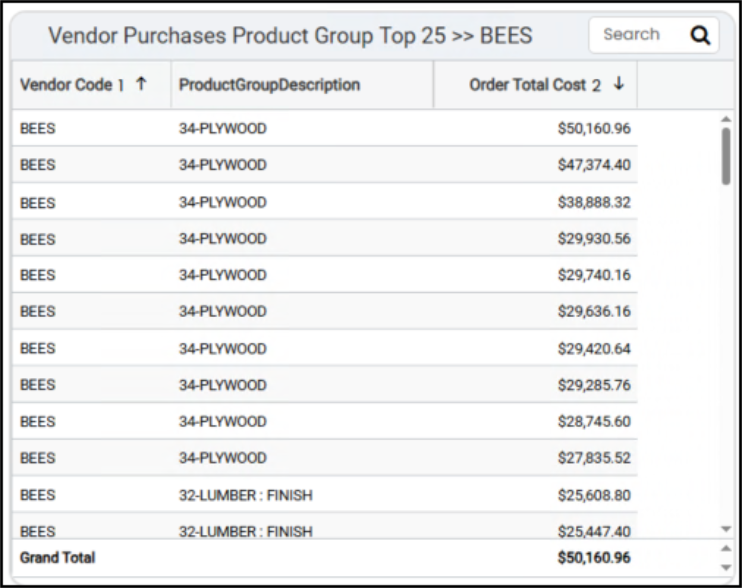
Purchasing Dashboard > Vendor Purchases by Product Group (One Vendor Selected)
When you convert the chart to a table, you can see the purchase details for the top 25 vendors and the grand total of purchase receipt amounts. You can filter this list by branch and vendor information, product group data, order date, and total order costs. You must have administrative credentials to review this data in detail.
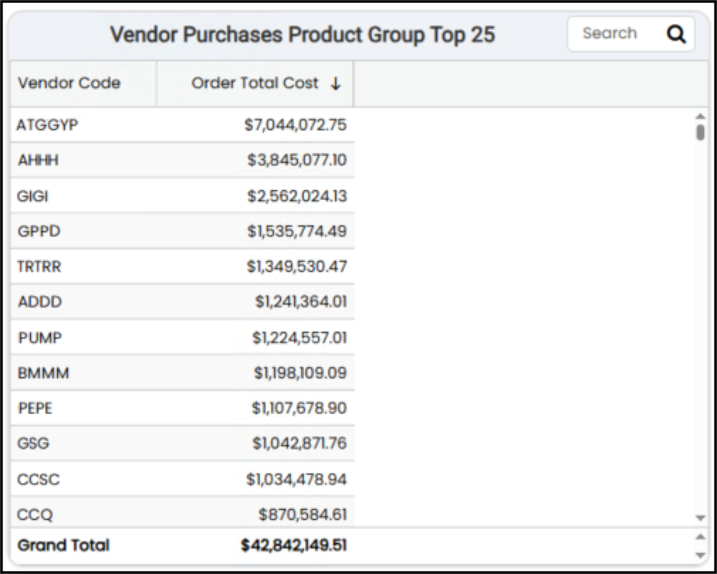
Purchasing Dashboard > Vendor Purchases by Product Group (Top 25) Table
The AI Insights for this widget might include:
-
Business Interpretation:
“Top Vendor Dominance: The analysis clearly identifies the top vendors by total purchase cost, with <vendor ID> being the most significant supplier by a substantial margin, accounting for <amount> in purchases. This represents a significant concentration of procurement spending.” -
Potential Business Decisions:
“Strategic Partnership with Top Vendors: Given the high volume of business with <vendor ID> and <vendor ID>, engage in strategic partnership discussions. Leverage this significant purchasing power to negotiate more favorable terms. This could include volume rebates, improved pricing tiers, priority fulfillment, or extended payment terms to enhance profitability and supply chain reliability.” -
Suggested Follow-Up Questions:
”Which of our business branches accounts for the largest share of purchases from our top vendors?”
See Also:
Working with Cognytics Dashboards
Current Dashboard List