Reviewing the Overview Dashboard (Cognytics)
The Overview Dashboard contains seven widgets designed for users responsible for the entire business, including all branches, from financial and inventory perspectives. These widgets show net sales compared to payments by month, sales, returns, and gross margin calculations for all branches for a specific date range, the outstanding valuation of payments by aging group, the quantity of open items by branch (including the value and the number of items), the key financial metrics including sales, COGS, cost corrections, and gross profit percentage by branch (daily, month-to-date, and year-to-date), and the inventory aging figures. The Dashboard filters for the widgets include:
-
Date filter (defaults to the current date)
-
Branch (defaults to All)
Business Owners and Branch or Store Managers can use this dashboard to gain an overview of the health of the business. They would probably use other dashboards to drill down into the details described here.
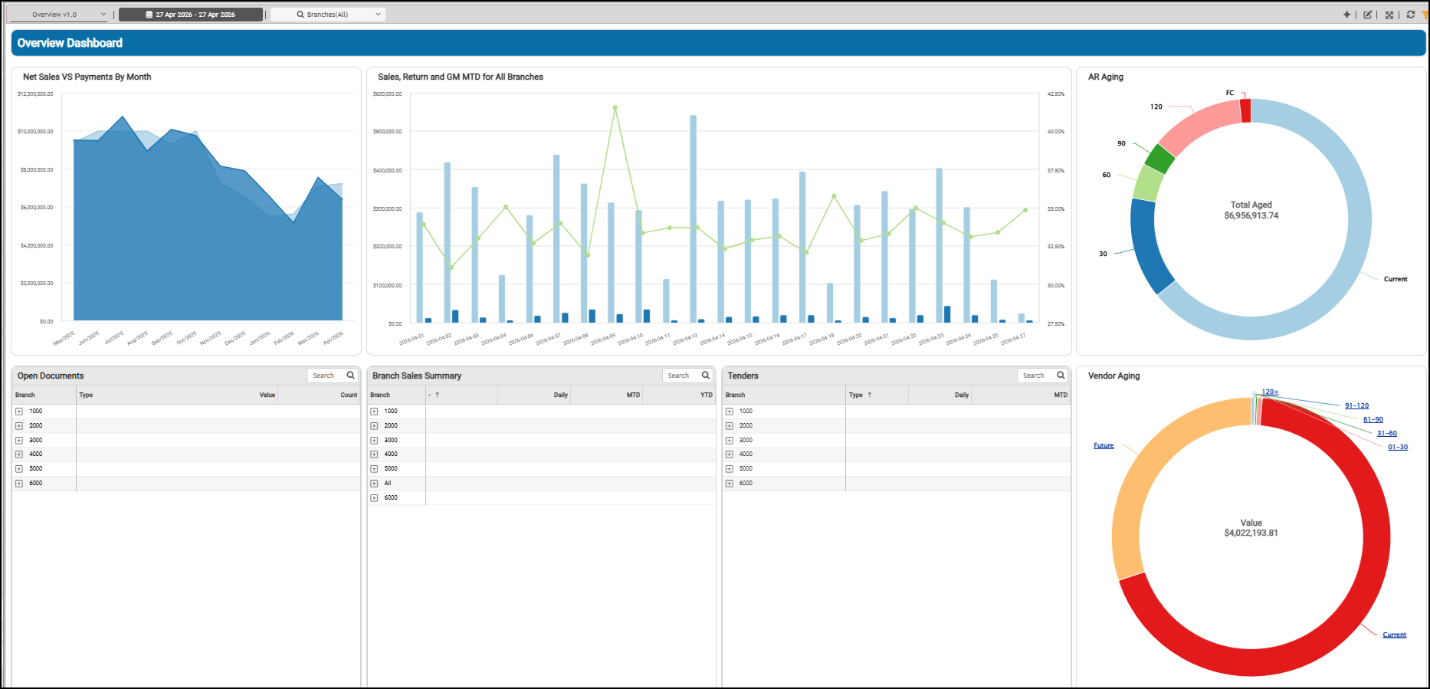
Overview Dashboard
Accounts Receivable Aging Widget (Overview Dashboard)
Widget Name: Ar Aging
View Name: COG_VW_ARAging
Historical: No
Drill-Down: Table
The Accounts Receivable Aging donut-style widget breaks down incoming receivables information by payment aging bucket (current, 30-day, 60-day, 90-day, and 120-day). Currently, credit balances and finance charges are not included in this calculation. Negative current balances are not included in this chart, but these values are reflected in the table.
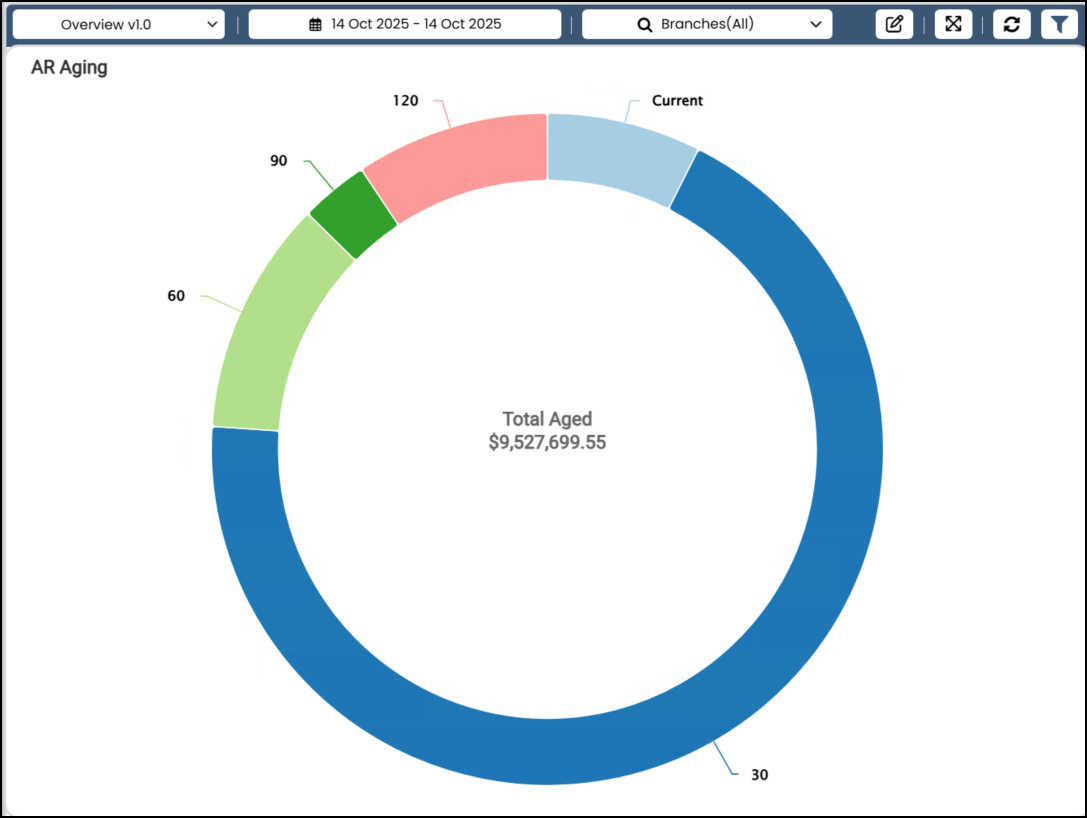
Overview Dashboard > AR Aging Widget Chart
When you generate the table, the individual bucket entries display, with the finance charge amounts and the credit balance for the current receivables. The table also shows the grand total. You can filter this table by AR aging bucket and branch information.
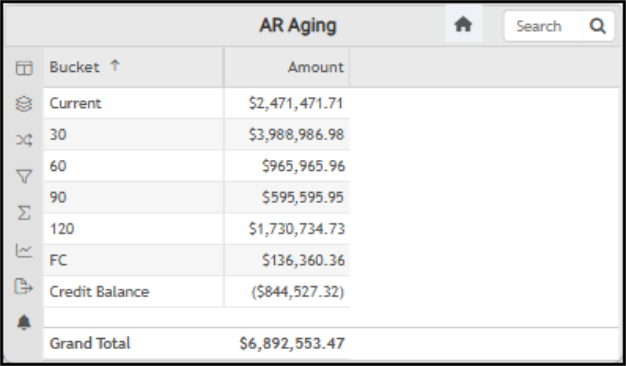
Overview Dashboard > AR Aging Widget Table
The AI Insights for this widget might include:
-
Business Interpretation:
“The largest single category is the <bucket name> bucket, with <amount> outstanding. This indicates that a significant portion of customers are slightly late on their payments, surpassing even the <bucket name> receivables of <amount>.” -
Potential Business Decisions:
“Target the 30-Day Bucket: Implement a proactive collections strategy for the <amount> in the <bucket name> bucket. This could include automated payment reminders or targeted calls to prevent these accounts from rolling into the more delinquent <next bucket name> category.” -
Suggested Follow-Up Questions:
“How has the amount in these aging buckets changed over different time periods?”
Branch Sales Summary Widget (Overview Dashboard)
Widget Name: Figures
View Name: COG_VW_Figures
Historical: No (Daily, MTD, and YTD Values)
Drill-Down: None
The Branch Sales Summary table widget provides an overview of sales metrics for each branch, including daily, month-to-date, and year-to-date statistics for sales, cost of goods sold, cost corrections, and gross profit. The data in these fields is based on the branch totals.
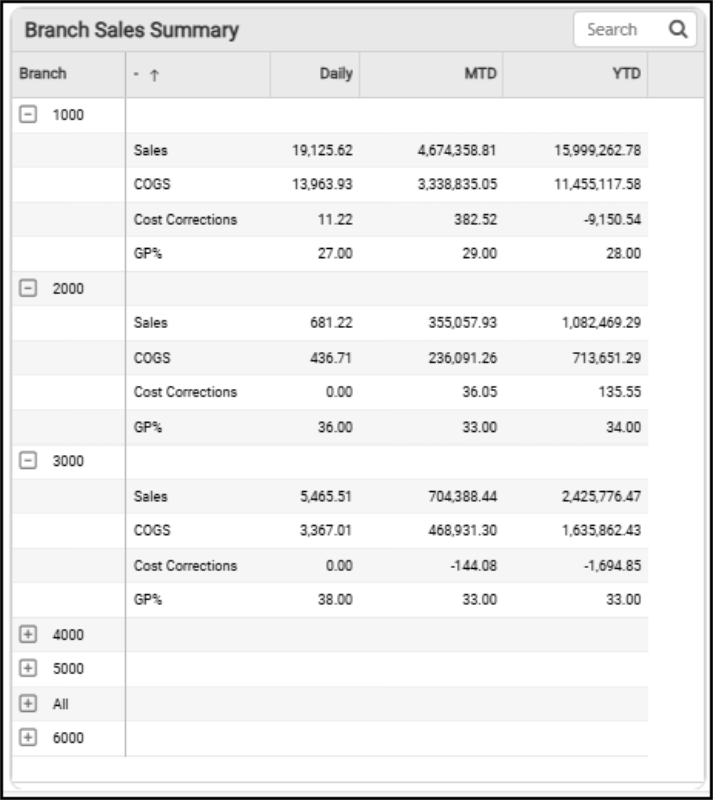
Overview Dashboard > Branch Sales Summary Table
The AI Insights for this table can include the following:
-
Business Interpretation:
“Performance Snapshot: The data provides a clear summary of key financial metrics. Year-to-date (YTD), the business has achieved over <amount> in sales, with a consistent Gross Profit (GP) margin of <percentage> for both the month-to-date (MTD) and YTD periods.” -
Potential Business Decisions:
“Investigate High Margin Daily Sales: The primary action is to immediately analyze the specific sales that contributed to the exceptional <percentage> GP margin for the day. Identify the products, product categories, or customer types involved to understand the drivers of this high profitability. Determine if this success can be replicated through targeted promotions or sales strategies.” -
Suggested Follow-Up Questions:
“Can we see a ranking of branches by their total sales for the current month?”
Net Sales vs. Payments By Month Widget (Overview Dashboard)
Widget Name: Net Sales vs Payments by Month v1.0
View Name: COG_VW_NetSalesvsPaymentsbyMonth
Historical: No
Drill-Down: Yes (Table)
The Net Sales vs. Payments By Month charts compare net sales values (cash + charge sales – cash and charge returns) with cash payments received during the same period, shown by month for the previous twelve months. The chart uses branch totals to calculate net sales, and payments are compiled from invoice data (including cash, check, and bank card payments). These payment amounts do not include coupons, gift cards, prior deposits, Capital One Credit, or receivables charges. These tables represent sales and payments from cash and receivables accounts.
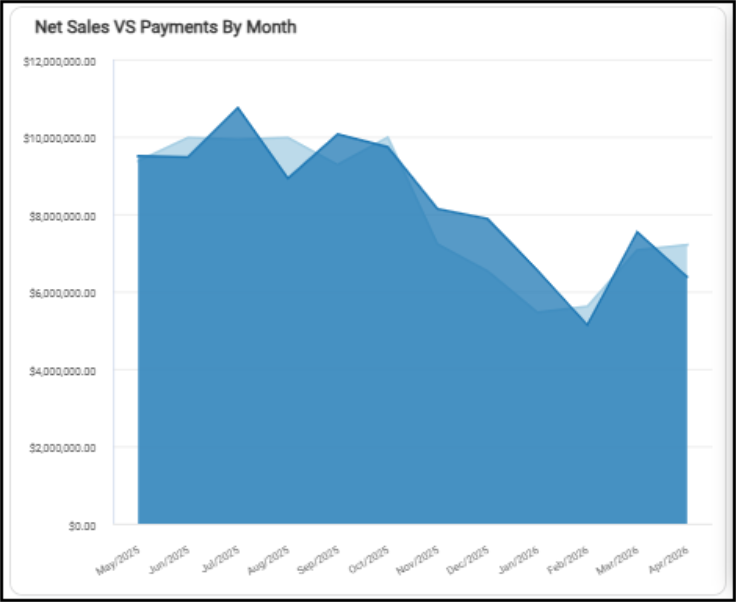
Overview Dashboard > Net Sales vs. Payments by Month Chart
You can review the individual values in these charts by hovering over them.
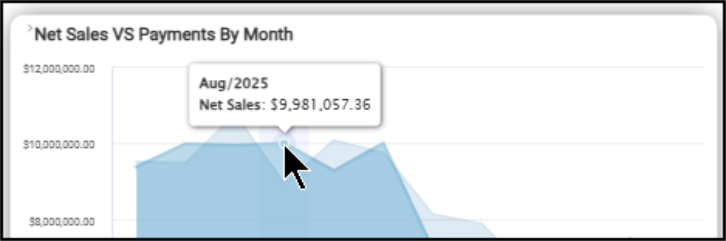
Net Sales vs Payments by Month > Net Sales Value for August 2025
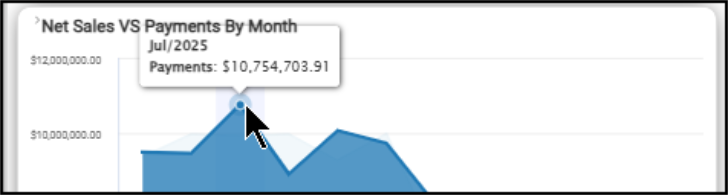
Net Sales vs Payments by Month > Payments for July 2025
When you review this information in table form, you also see the totals for sales and payments over the twelve month period.
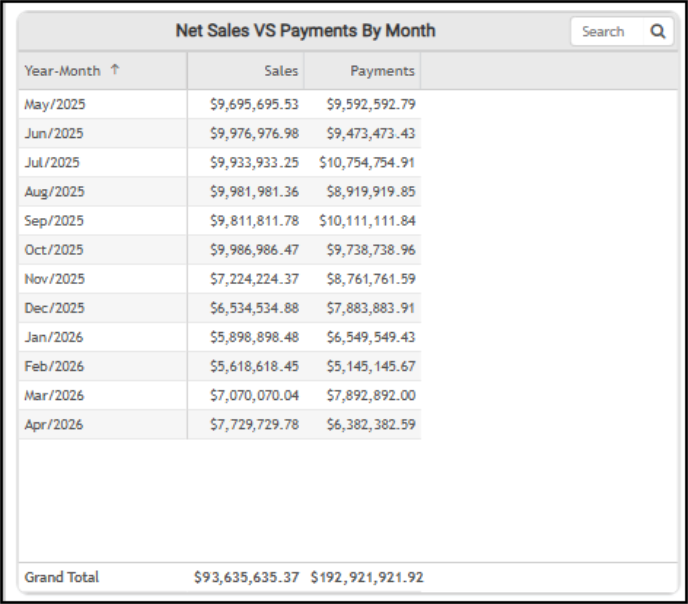
Overview Dashboard > Net Sales vs. Payment by Month Table
The AI Insights for this widget might include:
-
Business Interpretation:
“Temporal Trends & Seasonality: The data reveals a distinct seasonal pattern for both sales and payments over the observed period from <month/year> to <month/year>. Sales peaked in the <season> of <year>, reaching their highest in <month/year> at <amount>. Following this, there was a significant decline, with the lowest sales recorded in <month/year> at <amount>, which is typical for the LBM industry during <seasonal> months. Payments also showed a similar general trend, although with slightly different monthly peaks and troughs, reflecting the lag often associated with accounts receivable cycles.” -
Potential Business Decisions:
“Optimize Cash Flow Management: Given the observed seasonal fluctuations and the timing differences between sales and payments, implement or refine cash flow forecasting models. Focus especially on periods like <month/year> and <month/year> where payments significantly outpaced sales, to understand the drivers behind strong collections, and replicate strategies. Conversely, analyze periods like <month/year> where sales significantly outpaced payments to proactively manage accounts receivable and ensure timely collections.” -
Suggested Follow-Up Questions:
"For which months did the collected payments exceed the generated sales, and what was the difference for each of those months?”
You can filter this data by branch ID, year, month, payment, and sales totals settings.
Open Documents by Branch Widget (Overview Dashboard)
Widget Name: Open Items
View Name: COG_VW_OpenItems
Historical: No
Drill-Down: None
The Open Documents table widget lists the current document values and the counts of the open purchase orders, open quotes, resale items, and open orders by branch. The total value of the open items and the item count appear at the top of each branch's list.
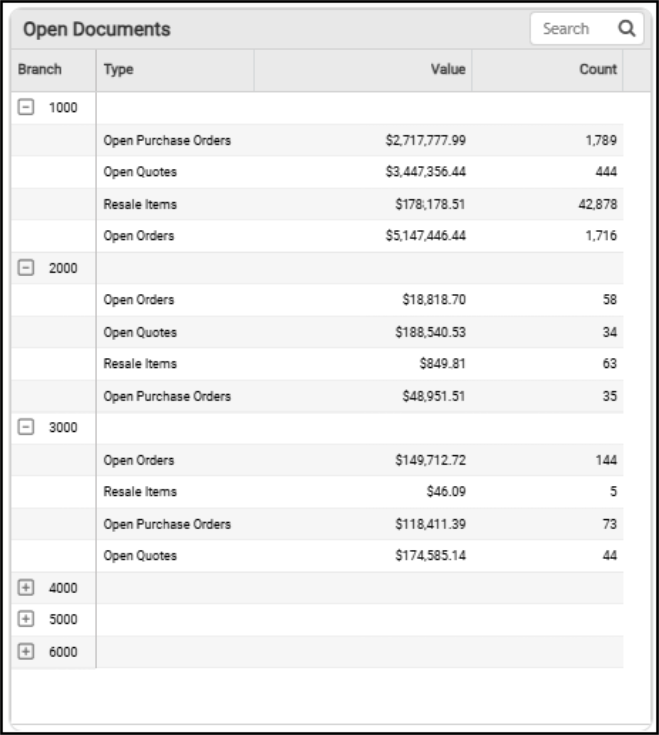
Overview Dashboard > Open Documents Table
The AI Insights options for this widget might share:
-
Business Interpretation:
“Sales Pipeline Health: The data reveals a robust sales pipeline with significant value at different stages. <Document Type> represents the largest potential revenue stream, with <quantity> <documents> totaling <amount>. This indicates strong initial customer interest and quoting activity.” -
Potential Business Direction
“Align Purchasing with Sales: Cross-reference the <quantity> <document type> against the materials required for the <quantity> of <related document type>. This ensures that incoming inventory is aligned with immediate demand, minimizing potential delays and managing stock levels effectively.” -
Suggested Follow-Up Questions:
“Which branches hold the highest value in <document type>?”
Sales, Return, and GM MTD for All Branches Widget (Overview Dashboard)
Widget Name: Sales Return and GM MTD for All Branches
View Name: COG_VW_SalesReturnsGMMtd
Historical: No (based on the fixed period of the current month)
Drill-Down: Table (Day of Month, Sales, Returns, and GM)
The Sales, Return, and Gross Margin Month-to-Date for All Branches column bar chart compares the current month-to-date sales amount (in blue), the Gross Margin (the green dot), and the returned items amount (dark blue amount below the green dot. The percentage on the right side refers to the gross margin applicable to these sales and returns. The data is collected from invoice and document records and excludes cancelled invoices.
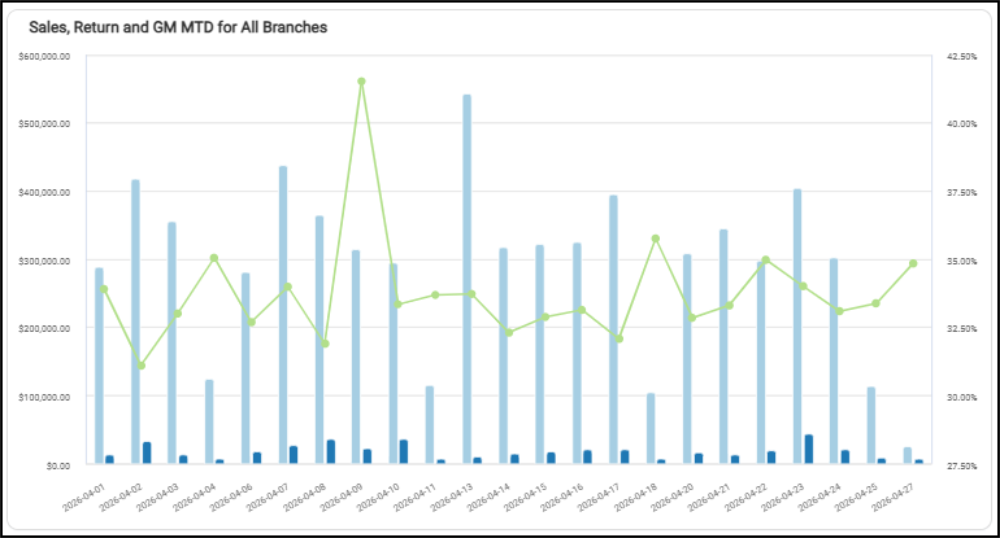
Overview Dashboard > Sales, Return, and Gross Margin MTD for All Branches
When you review this information as a table, you see the dollar amounts and percentages associated with these values.
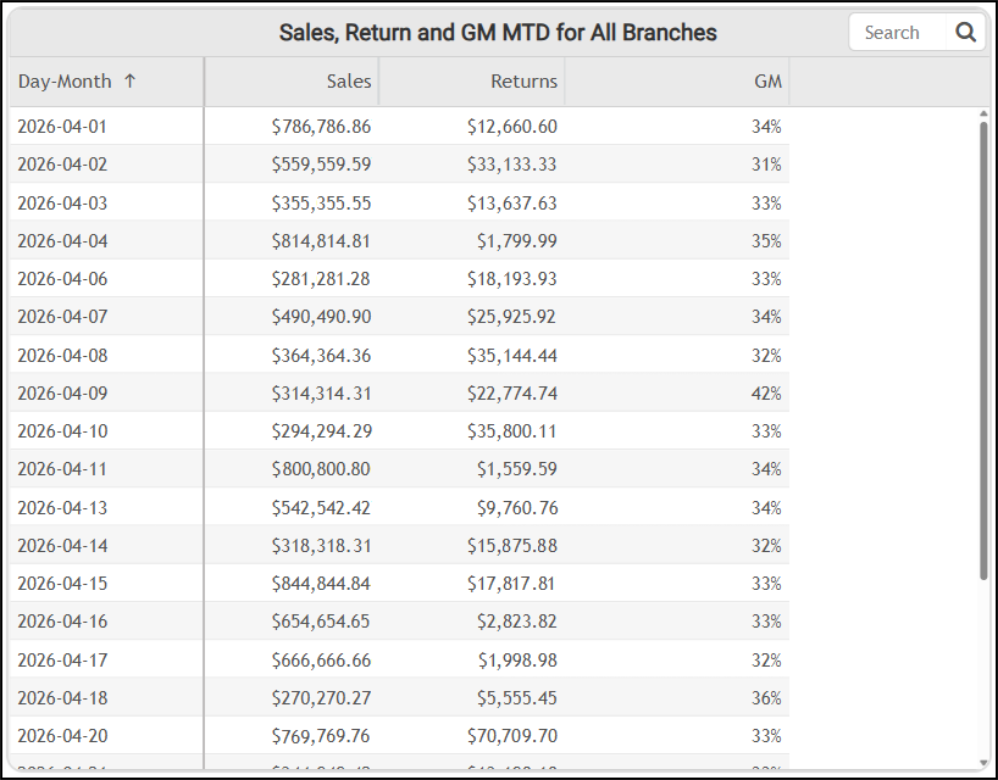
Overview Dashboard > Sales, Return, and Gross Margin for All Branches Table
The AI Insights for this widget might include:
-
Business Interpretation:
“Performance Peaks: The month-to-date data for <month> reveals significant daily performance variations. -
The highest sales day occurred on <month/day>, achieving <amount> in revenue.
-
The most profitable day, in terms of margin percentage, was <month/day>. On this day, the gross margin reached an exceptional <percent>, substantially higher than the typical range of <percent range> observed on other days. This peak profitability was achieved on sales of <amount>, suggesting a highly favorable product or customer mix.”
-
Potential Business Decisions:
“Analyze Profitability Drivers: A detailed analysis of the sales transactions from <date> is strongly recommended. Identifying the specific products, categories, or customer accounts that led to the <percentage> gross margin could uncover key opportunities for strategic pricing and promotions on high-margin items.” -
Suggested Follow-Up Questions:
“Can we see the days where the value of returns was more than 10% of that day’s total sales?”
You can filter the data in the table using the Average GM settings, Branch settings, using the date options, invoices, returns, sales, returns totals, sales totals, target gross margins, and ticket information.
Tenders Widget (Overview Dashboard)
Widget Name: Tenders
View Name: COG_VW_Tenders
Historical: No
Drill-Down: None
The Tenders table-style widget shows the payment methods customers use to pay on their accounts, by branch. This table displays the daily and the month-to-date amounts for cash, bank card, Bankers’ Automated Clearinghouse Services transactions (BACS, ACH in the UK), account charges, checks, Visa, and American Express credit cards. These records do not include applied deposits, taxable coupons, gift cards, or Capital One Trade Credit (formerly Blue Tarp) payment types.
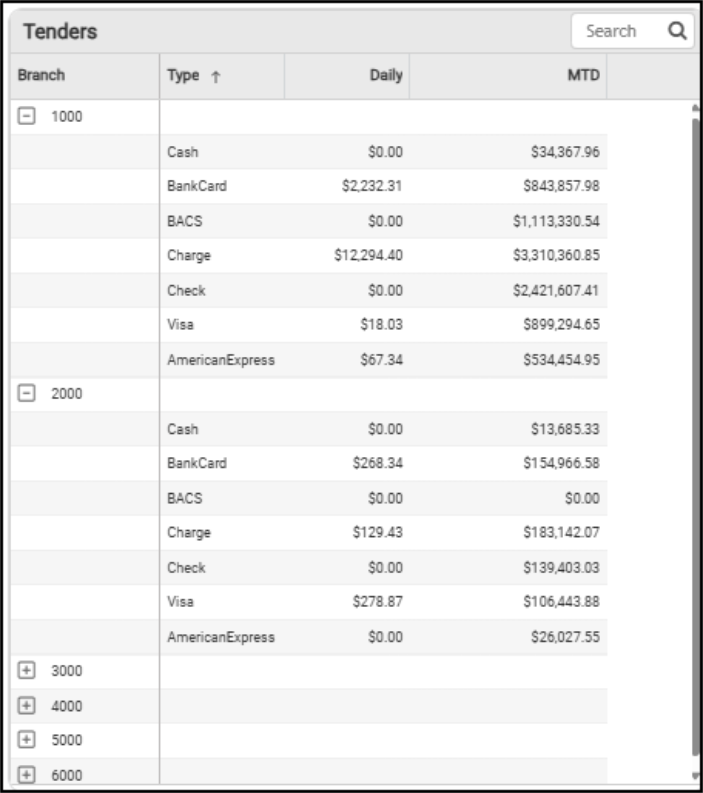
Overview Dashboard > Tenders Table
The AI Insights for this widget might include:
-
Business Interpretation:
“There is a notable anomaly where several tender types with substantial MTD totals, including <tender type> <amount> and <tender type> <amount>, show <amount> in the Daily sales column. This could indicate that payments via these methods are processed in batches on specific days rather than continuously, or there might be a lag in daily reporting for these types.” -
Potential Business Decisions:
“Strengthen Contractor Relationships: Given that <payment type> accounts represent the largest portion of the Daily Sales amount, focus strategic efforts on this customer segment. Consider loyalty programs, dedicated account management, or enhanced credit services to retain and grow this vital customer base.” -
Suggested Follow-Up Questions:
“How does the mix of daily payment types change on different days of the week ?”
Vendor Aging Widget (Overview Dashboard)
Widget Name: Vendor Aging
View Name: COG_VW_VendorAging
Historical: No
Drill-Down: None
The Vendor Aging Table donut widget quantifies the amount your business owes to vendors (suppliers), broken down by how long the invoices have been outstanding. The total amount outstanding displays in the middle of the chart. This chart is broken down by the typical aging buckets:
-
Current (1 – 30 days),
-
31 – 60 days,
-
61 - 90 days,
-
91 - 120 days,
-
120 days +, and
-
Future (when the due date is more than 30 days in the future).
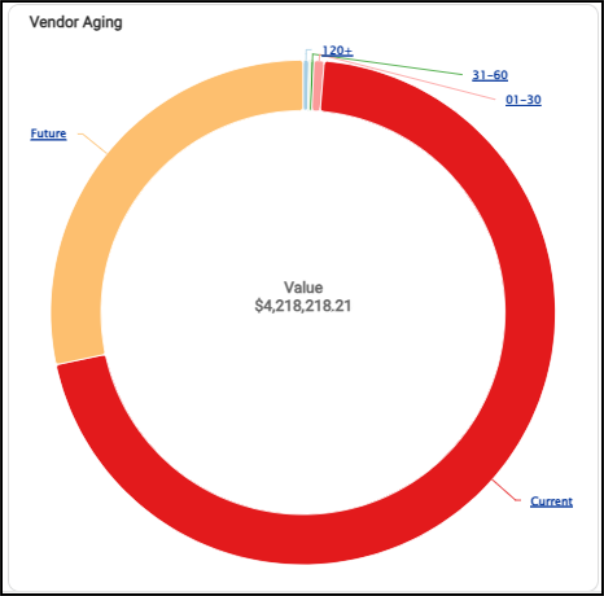
Overview Dashboard > Vendor Aging Chart
If you select the Current aging bucket link, the widget displays the breakdown of the outstanding amounts for that aging bucket by vendor ID and shows the grand total for that bucket.
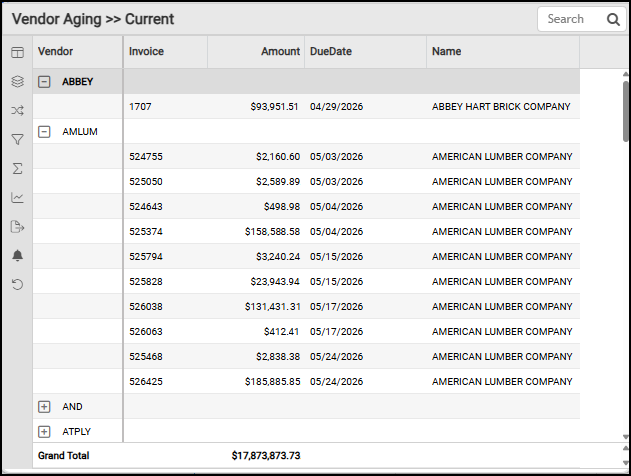
Overview Dashboard > Vendor Aging for Current Bucket Table
When you review the Vendor Aging table, you see the vendor amount due for each aging bucket, plus the credits that are also due to your business.
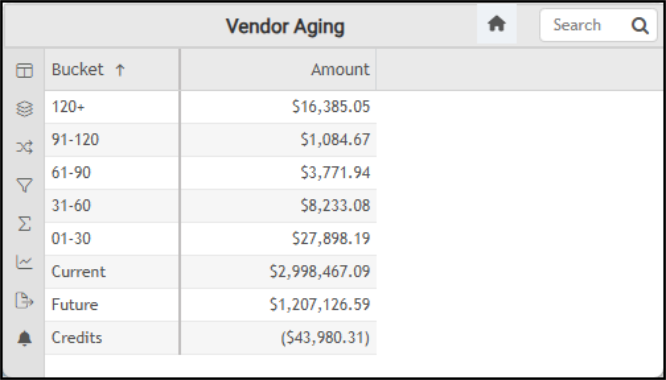
Overview Dashboard > Vendor Aging Table (All Buckets)
The AI Insights for this widget might include:
-
Business Interpretation:
"Overall Payable Health: The total accounts payable balance is substantial, with the vast majority concentrated in non-delinquent categories. The 'Current' liabilities stand at <amount>, and 'Future' obligations are <amount>, indicating healthy short-term financial management and that most payments are being managed within terms.” -
Potential Business Decisions:
“Prioritize Severely Aged Debt: Immediately investigate the <amount> in the <day quantity> aging bucket. Identify the specific vendors and invoices, and create a payment plan to resolve these critical debts to mitigate risks to supplier relationships and potential credit holds.” -
Suggested Follow-Up Questions:
“Which specific suppliers make up the critically overdue amount in the <day quantity> bucket?”
See Also:
Working with Cognytics Dashboards
Current Dashboard List