Reviewing the New Business Dashboard (Cognytics)
The eight widgets in the New Business Dashboard provide information on account-retention activity in the business. This includes a comparison of new business sales (and the number of accounts) with total sales to date. These widgets also show the new business as a percentage of the current total, which salespeople have been creating the new sales, the products the new customers are purchasing, the customer retention by month, an assessment of the purchasing trends of the new account holders, and a detailed listing of the gains and losses by account. You can filter the data in this dashboard by:
-
Date Range (defaults to previous year)
-
Accounts (defaults to all)
-
Sales Representative ID (defaults to all)
-
Branches (defaults to all)
This dashboard is particularly useful for Sales and Account Managers, Store/Branch Managers, and Owners.
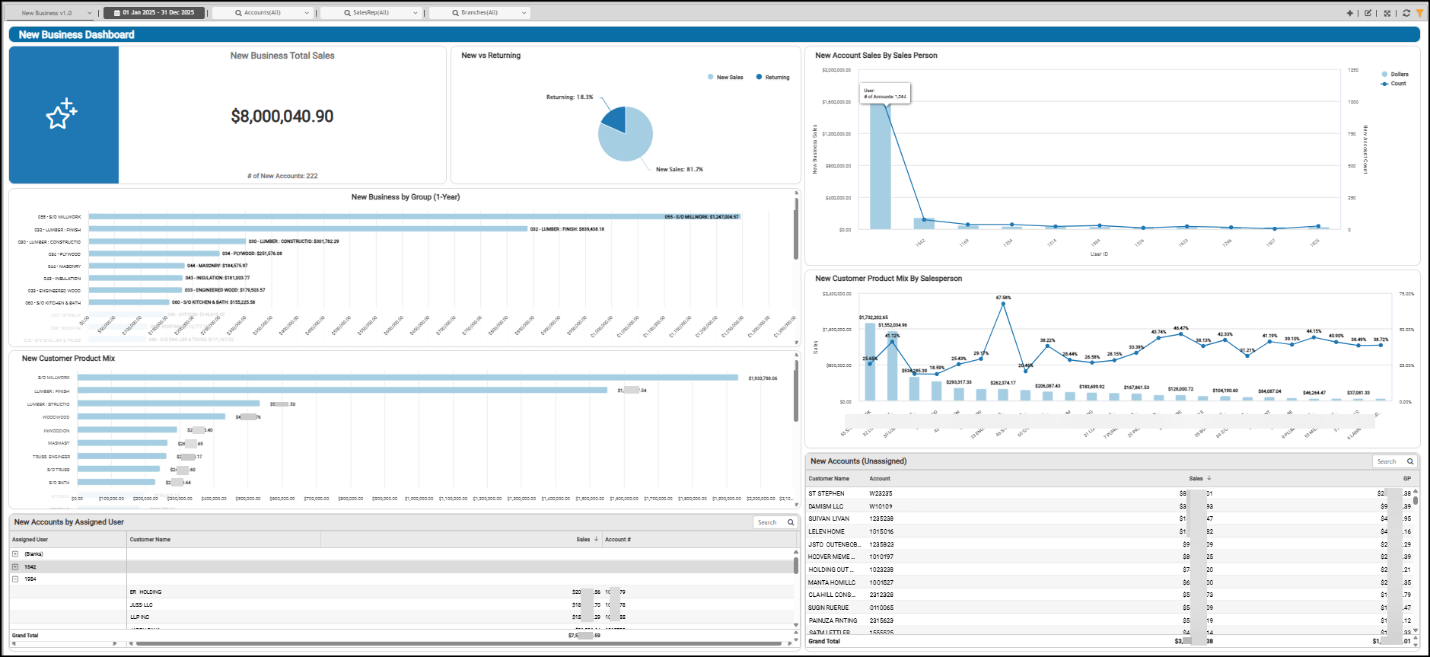
New Business Dashboard
New Account Sales by Sales Person Widget (New Business Dashboard)
Widget Name: New Account Sales by Salesperson v1.0
View Name: COG_VW_Newaccountsalesbysalesperson
Historical: No
Drill-Down: (User ID, Sales, Count)
The New Account Sales by Sales Person bar chart widget displays the sales each salesperson has made to new accounts within the specified date range. This chart shows the total new sales amount (value) and the number of new accounts each salesperson has added for the Dashboard date range.
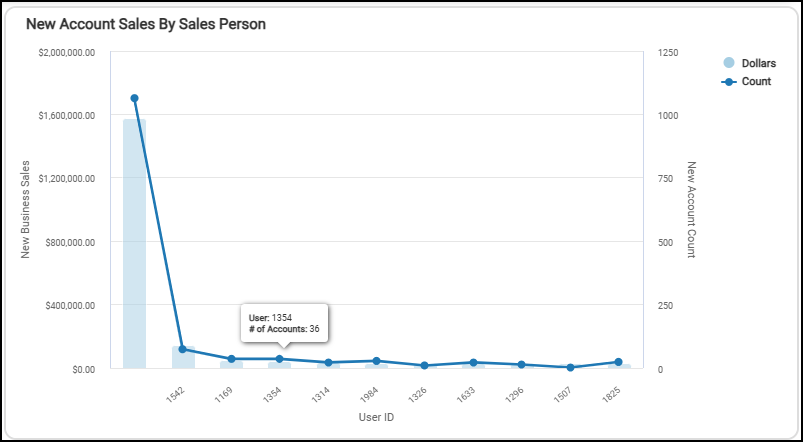
New Business Dashboard > New Account Sales by Sales Person Chart
The Table version shows the sales amount by user ID and the number of accounts reflected in that amount for the selected date range.
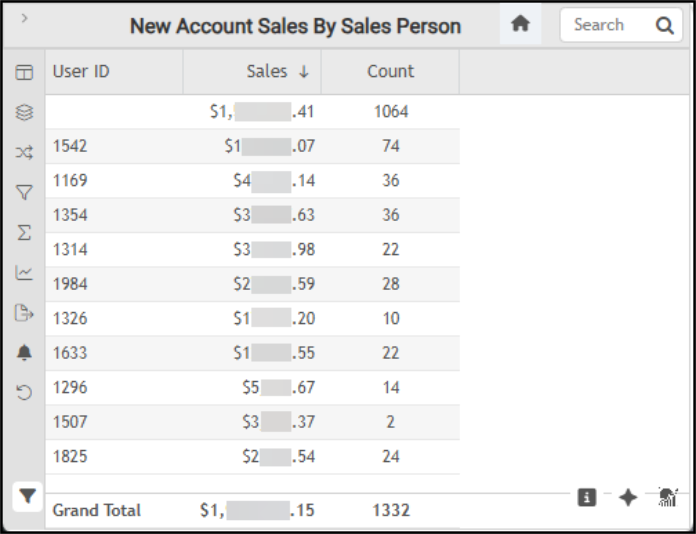
New Business Dashboard > New Account Sales by Sales Person Table
The AI Insights tabs for this widget might include:
-
Business Interpretation:
“There is a notable concentration of new account sales among a few top performers. After the leading salespeople, the contributions from others significantly decrease, with several salespersons having relatively lower sales volumes and new account counts (e.g., <user ID> with <sales amount> from <number of new accounts>). This suggests a varying level of effectiveness in new account generation across the sales team.” -
Potential Business Decisions:
“Conduct a detailed analysis of the sales strategies, customer engagement techniques, and lead sources utilized by top-performing salespersons, particularly <user ID> and <user ID>, to identify and document best practices for new account acquisition.” -
Suggested Follow-Up Questions:
“Could we see the breakdown of new account sales and the number of new accounts for each salesperson, organized by their respective branches?”
You can filter this information using the account information, branch data, customer class, date the account was added, sales representative information, totals, and other user information.
New Accounts by Assigned User Widget (New Business Dashboard)
Widget Name: New Accounts by Product Group
View Name: COG_VW_Newaccountsbyproductgroupnewbusiness
Historical: Yes
Drill-Down: Tree (within table to expand and view Customer Name/Account and Sales total)
The New Accounts by Assigned User widget displays the total sales for the date range by assigned user (salesperson) ID. New accounts that do not have an assigned salesperson display in the Blank list at the top. We define New Accounts as customers added within the Dashboard’s date range. The Sales amount reflects the extended amount of the customers' invoices, including freight (but not taxes), based on the customers' purchases. Currently, this amount reflects only the account’s standard invoices (excluding direct ship or installed sales transactions), and Charge Returns are not included.
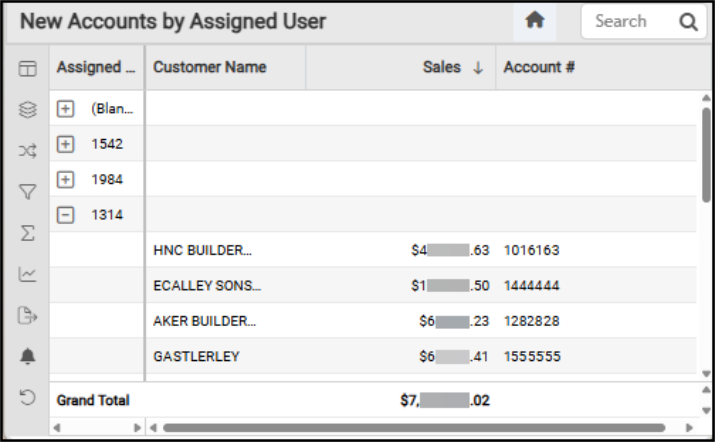
New Business Dashboard > New Accounts by Assigned User
The AI Insights tabs for this widget might include:
-
Business Interpretation:
“The analysis of new accounts reveals that a substantial portion of sales, totaling <amount>, originates from accounts that are currently unassigned to a specific user. This represents a significant untapped potential for direct sales management.” -
Potential Business Decisions:
“Implement a clear strategy for assigning sales representatives to the <amount> worth of new accounts currently without an assigned user. This could involve prioritizing accounts based on potential, industry, or geographic location.” -
Suggested Follow-Up Questions:
“How do sales from new accounts compare when grouped by the date they were established, focusing on monthly or quarterly trends?”
You can filter this list by account and branch information, customer class, the date the customer was added to the system, the group information of the purchased products, the sales representative associated with the account, the sales amounts, and the user ID associated with the transaction.
New Accounts (Unassigned) Widget (New Business Dashboard)
Widget Name: New Accounts v1.0
View Name: COG_VW_Newaccounts
Historical: Yes
Drill-Down: None
The New Accounts Unassigned table widget shows the new customer information, the sales amount, and the new account’s gross profit that are currently not associated with a salesperson within the Dashboard date range. It also displays each customer’s name and account ID for non-cash accounts.
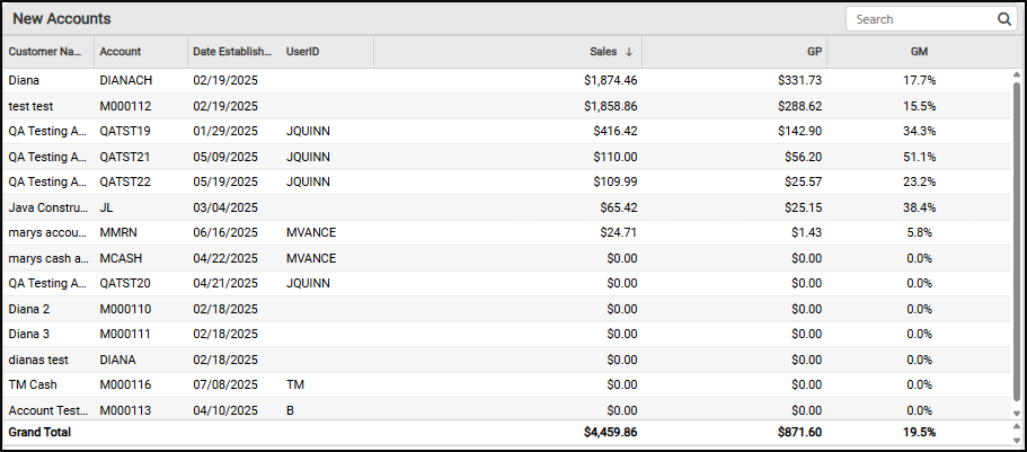
New Business Dashboard > New Accounts Detail
The AI Insights tabs for this widget might include:
-
Business Interpretation:
“Top Performing New Accounts: The analysis of new accounts reveals a significant variance in their initial sales performance. <Customer name> stands out as the highest performer among the new accounts, generating an impressive <amount> in sales and a gross profit of <amount>. Other strong new accounts include <account name> with <amount> in sales, <account name> with <amount> in sales, and <account name> with <amount> in sales. These accounts are clearly demonstrating early success and significant value.” -
Potential Business Decisions:
“Investigate Negative Gross Profit Transaction: Immediately investigate the transaction associated with <account name> that resulted in a negative gross profit. Determine if this was due to a pricing error, a return with specific conditions, or another operational issue, and implement controls to prevent recurrence.” -
Suggested Follow-Up Questions:
“Can we analyze the sales performance of these new accounts by their assigned branch to identify regional strengths or weaknesses?”
You can filter this table by account information, branch, new account date, sales dollar amount, dollar cost, and user ID information.
New Business by Group (1-Year) Widget (New Business Dashboard)
Widget Name: New Business by Group v1.0
View Name: COG_VW_Newbusinessbygroupnewbusiness
Historical: No
Drill-Down: Table
The New Business by Group (1-Year) bar chart widget displays new item sales by inventory product group in descending order from the highest sales item group (top) to the lowest (sales) item group at the bottom (x-axis). This calculation includes orders, sales, and installed sales and excludes open tickets, canceled orders or sales, and charge returns.
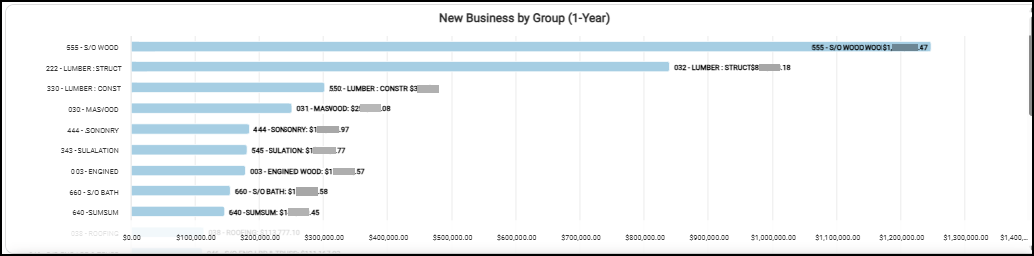
New Business Dashboard > New Business by Group (1 Year)
We define New products as items purchased by accounts with an established date within the past year (such as -1 year from the current date), based on invoice details and header tables, inventory common, group-section, customer {master}, and documents. When you display the data as a table, there is also a grand total.
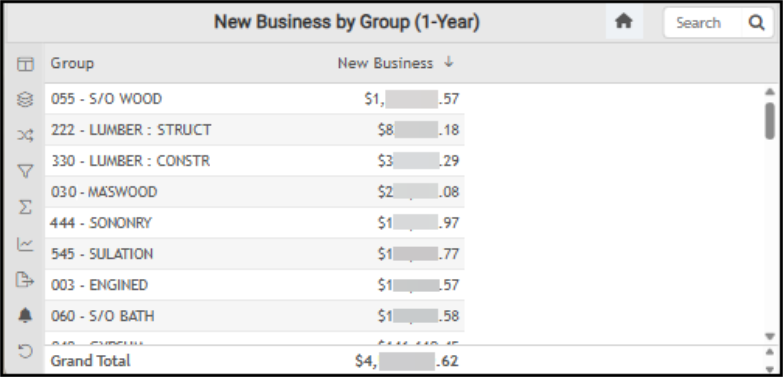
New Business Dashboard > New Business by Group (1 Year) Table
The AI Insights tabs for this widget might include:
-
Business Interpretation:
“Top Performer Identified: The <top group ID and group name> is the undisputed leader in new business generation, contributing a substantial <amount>. This highlights a significant strength in <inventory group name>, likely catering to custom projects or specific client needs within the industry.” -
Potential Business Decisions:
“Deep Dive into <top group name> Success: Investigate the specific factors, sales strategies, and customer profiles that are driving the exceptional new business in <top group name>. Develop a playbook to replicate these successful approaches in other high-value or special order categories.” -
Suggested Follow-Up Questions:
“Can we analyze the new business contribution from each branch location?”
There are several filter options for this data, including account and branch information, the date the customer account was added, product description, entry date, extended amount and sales costs, product group, and invoice type. You must have administrative access credentials to review this data in detail.
New Business Total Sales Widget (New Business Dashboard)
Widget Name: New Business Total Sales v2.0
View Name: COG_VW_NewvsReturning v1.0
Historical: No
Drill-Down: None
The New Business Total Sales headline widget displays the total sales from new accounts (within the dashboard’s date range) and the total number of new accounts added during that period. This does not include cash accounts or tax amounts.
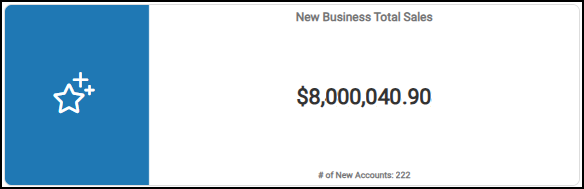
New Business Dashboard > New Business Total Sales Chart
You can review the filter options for this chart, including account, new-business date, new account status, and amount totals for new accounts only.
New Customer Product Mix by Salesperson (Gross Margin) Widget (New Business Dashboard)
Widget Name: New Customer Product Mix by SalesPerson v1.0
View Name: COG_VW_Newcustomerproductmixbysalespersonnewbusiness
Historical: Yes
Drill-Down: Table (Groups, Sales (Descending), and GM)
The New Customer Product Mix by Salesperson column and bullet chart widget displays the total sales of products purchased by new customers within the specified date range, along with their corresponding gross margin percentages. You can use the Dashboard filter (SalesRep) to filter this chart by one salesperson. The Sales amount is calculated using the extended amount of sales (excluding adjustments and taxes), and the widget uses the inventory’s extended costs to calculate the gross margin amount.
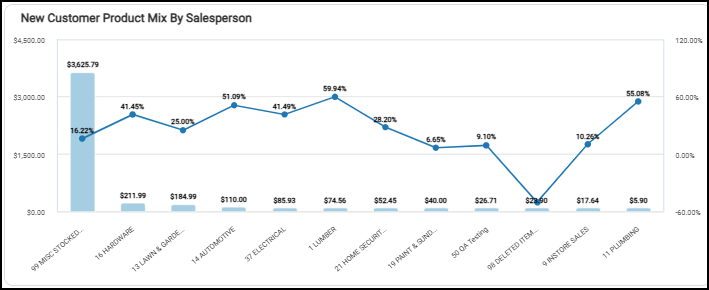
New Business Dashboard > New Customer Product Mix by Gross Margin Widget
When you expand the chart to the table, you can also see the sales and gross margin information by group. You can filter this table by branch information, the date the account was added, the extended amount and costs, group information, and invoice type. You must have administrative credentials to review this data in detail.
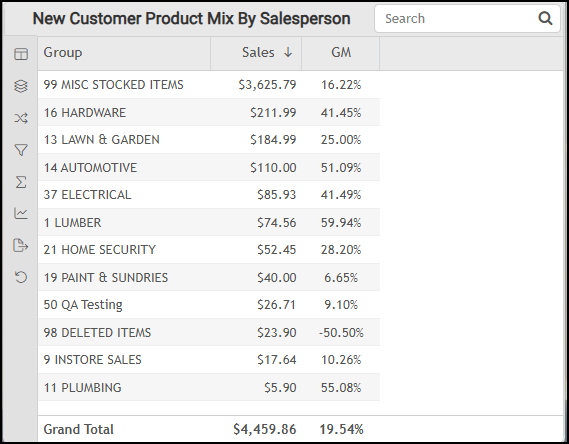
New Business Dashboard > New Customer Product Mix by Salesperson Table
The AI Insights tabs for this widget might include:
-
Business Interpretation:
“Special Order Dominance: Multiple 'S/O' (Special Order) categories appear among the top performers, particularly <group ID and description> leading in sales, suggesting that new customers frequently engage in custom or project-specific purchases, highlighting the importance of efficient special order fulfillment.” -
Potential Business Decisions:
“Optimize Pricing and Cost for High-Volume, Low-Margin Products: Conduct a thorough review of the pricing strategies and procurement costs for <group ID and description> and <group ID and description> to identify opportunities for incremental margin improvements without negatively impacting their substantial sales volume with new customers. ” -
Suggested Follow-Up Questions:
“Can we analyze the trend of sales and gross margins for the top 3 product groups over time, based on the transaction entry date for new customers? ”
You can filter this list by AR branch, assigned user (salesperson), date the account was added, product descriptions, extended amounts, extended costs, group information, invoice type, sales representative information, and user ID.
New Customer Product Mix Widget (New Business Dashboard)
Widget Name: New Customer Product Mix Bar v1.0
View Name: COG_VW_Newcustomerproductmixnewbusiness
Historical: Yes (based on the established date of the customer)
Drill-Down: Table
The New Customer Product Mix bar widget displays the inventory group purchase history of new customers… from highest to lowest. The sales amount for each product group is calculated based on the sum of the new account purchases (the extended amounts (including freight but excluding taxes)) taken from the invoices processed after the new customer account’s established date. Customers are considered “New” if their accounts were added within the Dashboard date range. Currently, only standard invoices are included (no direct ship or installed sales). Returns are not considered.
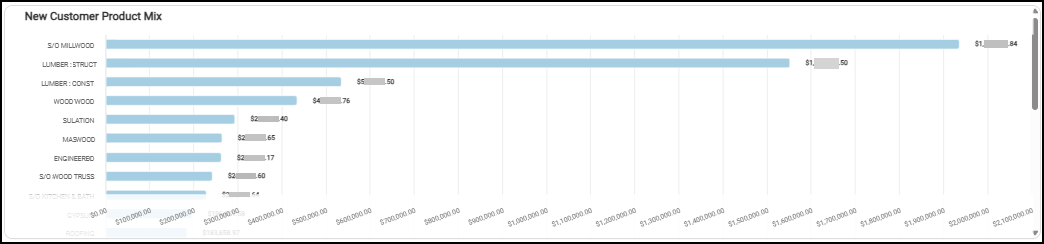
New Business Dashboard > New Customer Product Mix Chart
The New Customer Product Mix table also displays the product group sales value of the new customers’ purchases and the grand total of the sales amount.
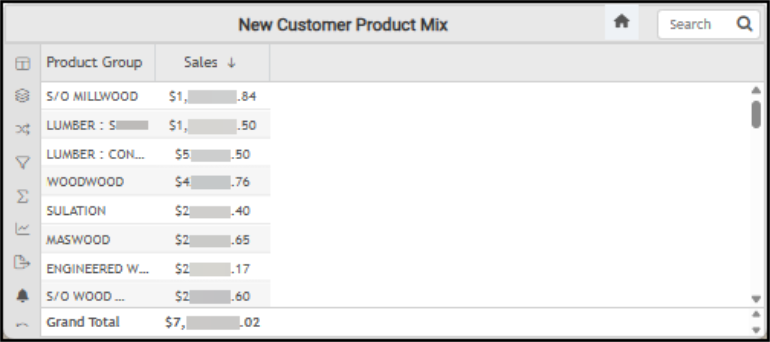
New Business Dashboard > New Customer Product Mix Table
The AI Insights tabs for this widget might include:
-
Business Interpretation:
“The product mix shows a strong concentration in a few key categories. <Product group description> leads significantly with sales of <amount>, followed by <product group description> at <amount>. These two categories alone represent a substantial portion of the total sales, highlighting their critical importance to the business.” -
Potential Business Decisions:
“Capitalize on High-Performing Categories:** Develop enhanced sales and marketing strategies for <product group description> and <product group description> to further drive growth. This could include preferential inventory stocking, dedicated sales promotions for contractors, or exploring upselling/cross-selling opportunities with related high-demand products.” -
Suggested Follow-Up Questions:
“What were the sales contributions from each operating branch for the top-performing <product group description>?”
You can filter this list by account information, AR branch, customer class, account establishment date, product group description, extended amounts, extended costs, group, invoice type, sales representative, and user ID.
New vs. Returning Sales Widget (New Business Dashboard)
Widget Name: New VS Returning v1.0
View Name: COG_VW_NewvsReturning v1.0
Historical: No
Drill-Down: None
The New versus Returning Sales circle widget shows the percentage of total sales that new sales vs. returning sales represent over the dashboard’s date range. That is, accounts with an established date prior to the current date range versus those within the established dashboard date range. This calculation excludes cash sales.
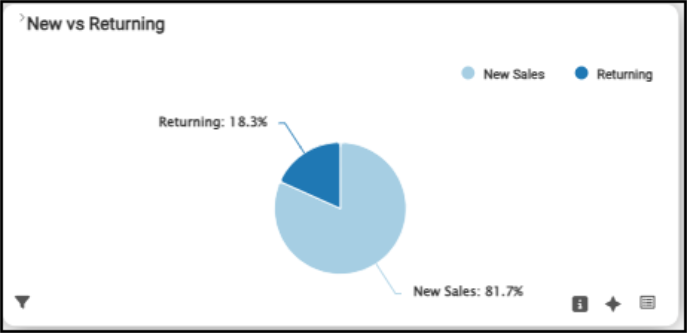
New Business Dashboard > New vs. Returning Sales Chart
The table view displays the exact amounts for new and returning sales and shows the grand total at the bottom.
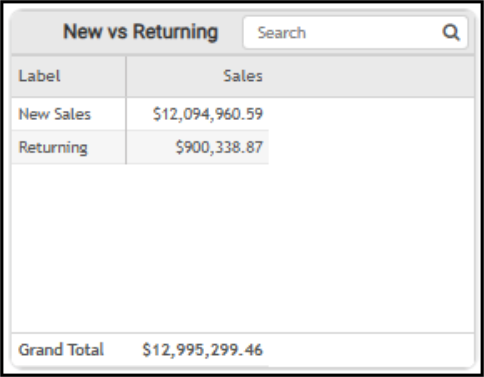
New Business Dashboard > New vs. Returning Sales Table
The AI Insights tabs for this widget might include:
-
Business Interpretation:
“Opportunity with Returning Customers: Sales from 'Returning' customers amounted to <amount>, representing only about <percentage> of the total. This suggests a strong reliance on new customer acquisition for revenue growth within the domain, and potentially an underdeveloped segment for repeat business or loyalty among existing clientele.” -
Potential Business Decisions:
“Optimize New Customer Engagement: Given that over <percentage> of sales are from new customers, it is crucial to analyze and document the strategies and channels most effective in acquiring these high-value 'New Sales'. Identifying what drives these initial large purchases can help in refining and scaling acquisition efforts.” -
Suggested Follow-Up Questions:
“How have the total sales generated by new customers and returning customers evolved month-over-month or quarter-over-quarter? ”
You can sort this list by account number, branch, sales dollar amount, and total dollar amount as needed. The table view of this data includes a grand total amount.
See Also:
Working with Cognytics Dashboards
Current Dashboard List