Reviewing the DailyDashboard (Cognytics)
The DailyDashboard serves as a starting point for many team members each day, as it shows current statistics across a broad range of financial, sales, and inventory areas.
Note: The current DailyDashboard widgets are under review.
This information is useful to Back Office Managers, Purchasing and Inventory Managers, Sales and Account Managers, Store and Branch Managers, and Owners.
Daily Dashboard
This dashboard is meant to give managers from different departments a common overview of the business, so these widgets do not include much detail. As such, there are no dashboard-wide filters.
Current Accounts Receivable Status Details Widget (DailyDashboard)
Widget Name: Current AR Drill-Down
View Name: Rs_currentarstatusdrilldown
Historical: No
Drill-Down: None
The Current Accounts Receivable Status Details widget shows the account details of all current accounts, including the amounts due by aging bucket. You can filter the entries in this table by account number, customer name, aging buckets, past-due balance, dollar amounts, percentage of AR status, and the sum of past due balances.
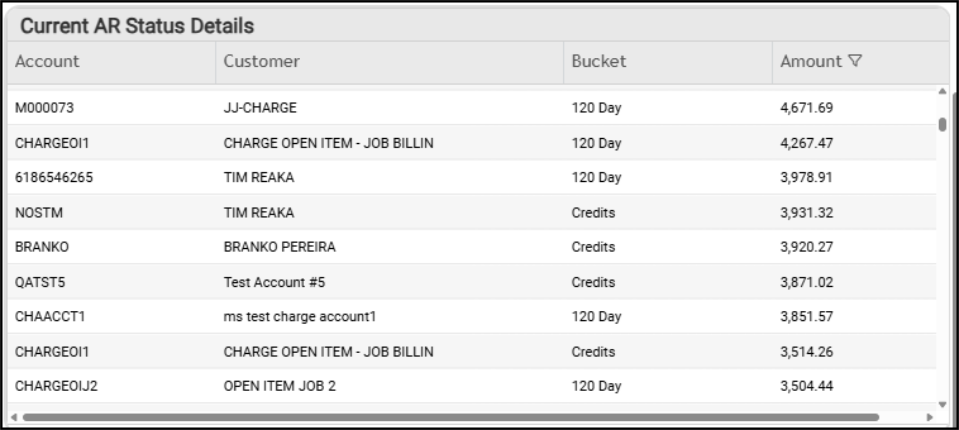
DailyDashboard > Current Accounts Receivable Status Details Table
Current Accounts Receivable Status Widget (DailyDashboard)
Widget Name: ARStatus
View Name: RS currentarstatus
Historical: No
Drill-Down: None
The Current Accounts Receivable Status widget shows you the accounts receivable amounts and percentages by aging bucket, as well as the total outstanding credits. We recommend using the Current AR Status Details widget to dig into this information.
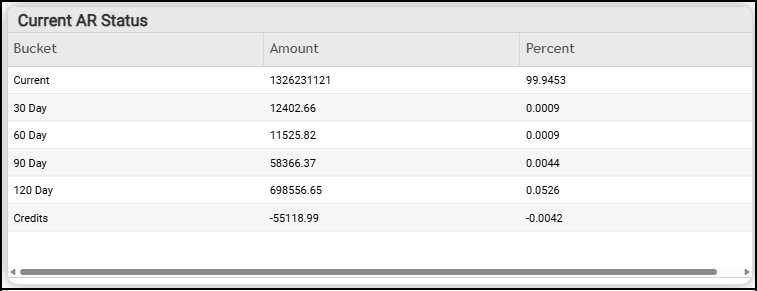
DailyDashboard > Current Accounts Receivable Status Table
Inventory (Category and Value) Widget (DailyDashboard)
Widget Name: Inventory
View Name: RS inventoryasof
Historical: No
Drill-Down: None
The Inventory Category and Value widget displays the financial details of items in inventory, categorized by value. You can filter this list by category value, amount, and the total.
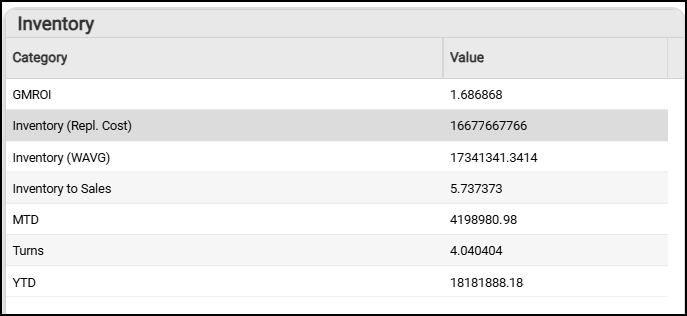
DailyDashboard > Inventory Category and Value Table
Month-to-Date Comparison Widget (DailyDashboard)
Widget Name: MTD Comparison
View Name: RS salesperformance
Historical: No
Drill-Down: None
The Month-to-Date Comparison table provides an update of the basic financial metrics for the business (as a whole). This table shows the month-to-date totals on average sale amounts and percentages (including the previous year), cost of goods sold, cash and charge sales percentages, gross profit percentage and amounts, net sales percentages and amounts, and a month-to-date transaction count. You can apply filters for categories, daily sales performance, month-to-date for the current year (amount and percentage), month-to-date for the previous year (amount and percentage), and a variance assessment.
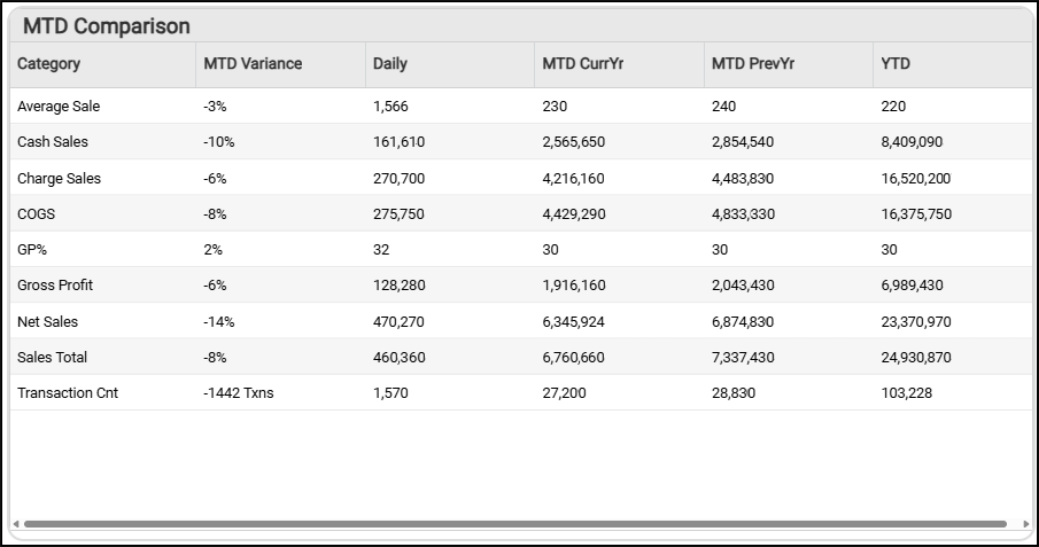
DailyDashboard > Month-to-Date Comparison Table
Month-to-Date Sales by User Widget (DailyDashboard)
Widget Name: MTD Sales by User
View Name: RS mtdsalespersonperformance
Historical: No
Drill-Down: None
The Month-to-Date Sales by User widget shows sales by salesperson, including gross profit percentage and the total sales amount.
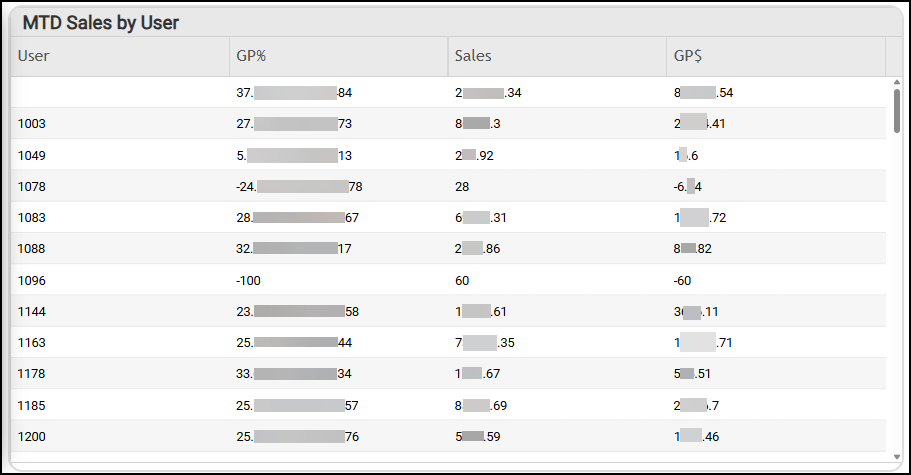
DailyDashboard > MTD Sales by User Widget
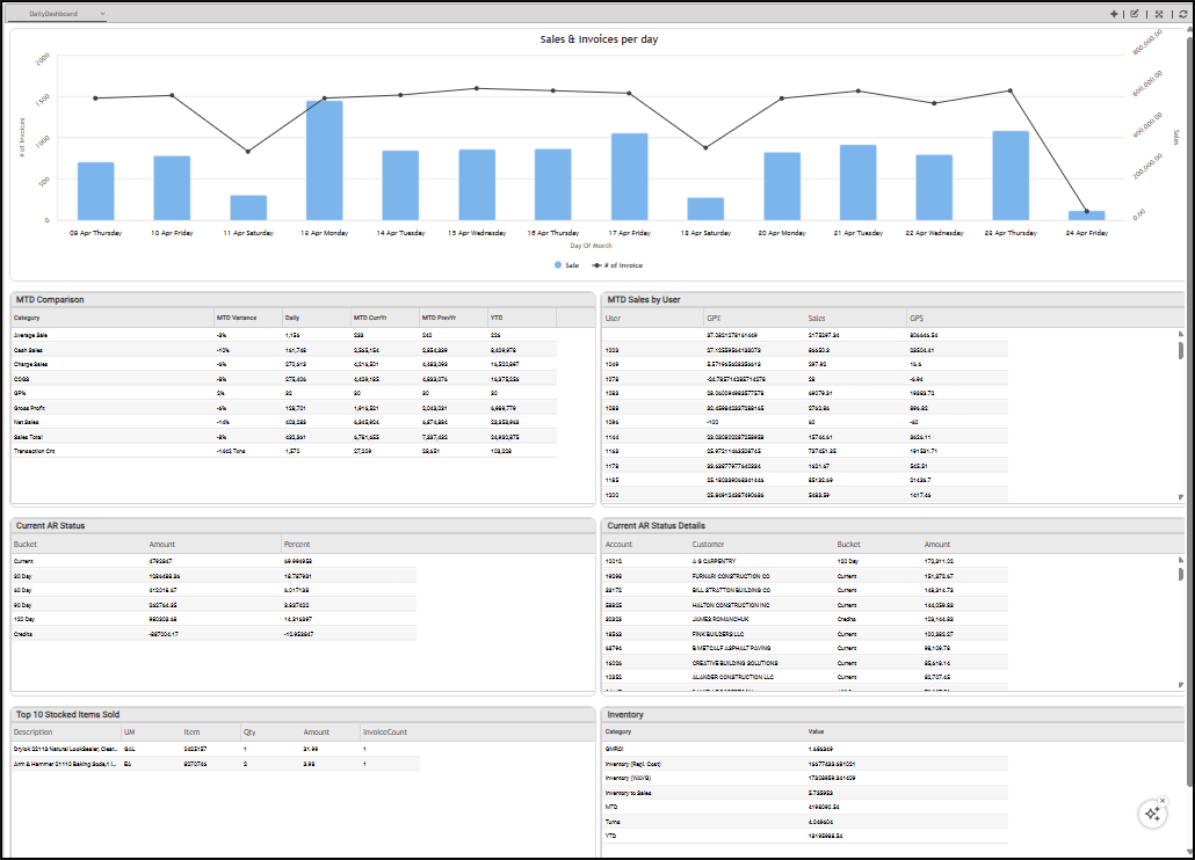
Sales and Invoices per Day Widget (DailyDashboard)
Widget Name: Sales & Invoices per day
View Name: Sales and Invoiceperday
Historical: No
Drill-Down: None
The Sales and Invoices per Day bar and line graph widget shows the number of invoices and the total sales amounts for the previous two weeks. The filters provide access to the Number of Invoices, the Day of the Month (affecting the Sales and Invoice per Day results), and the sum totals of the Invoice and Sale amounts shown in the chart. There is no table associated with this widget.
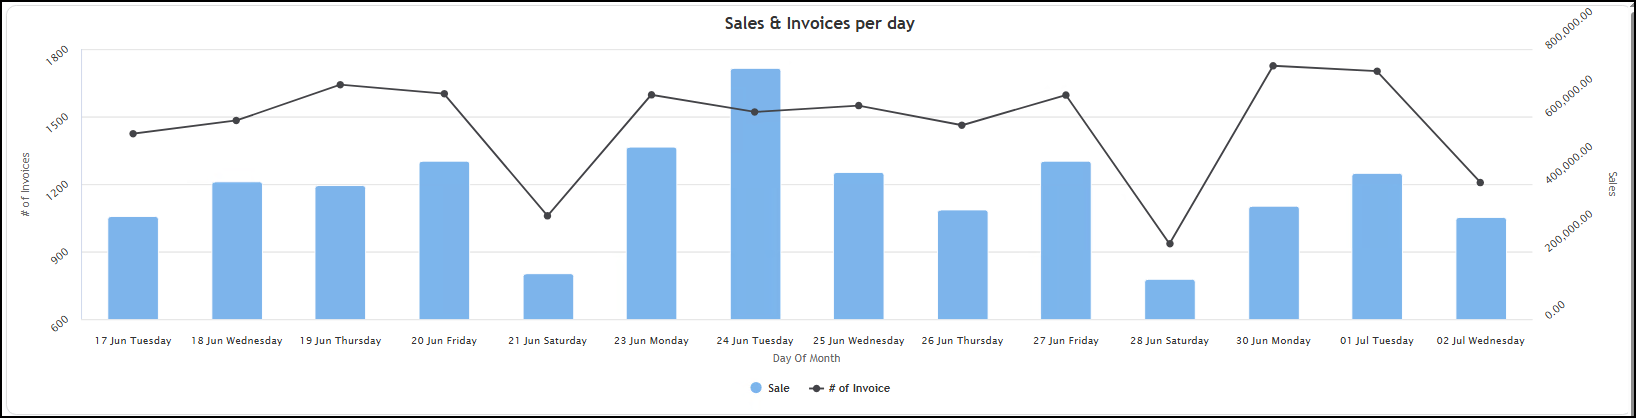
DailyDashboard > Sales & Invoices per Day Chart
Top 10 Stocked Items Sold Widget
Widget Name: Top Stocked Items Sold AgG
View Name: RS TopStockedItemsSold
Historical: No
Drill-Down: None
The Top 10 Stocked Items Sold table widget displays the top items sold by item ID, Description, Unit of Measure, Quantity Sold, Sales Amount, and Invoice Count.
<This widget is under construction.>
See Also:
Working with Cognytics Dashboards
Current Dashboard List