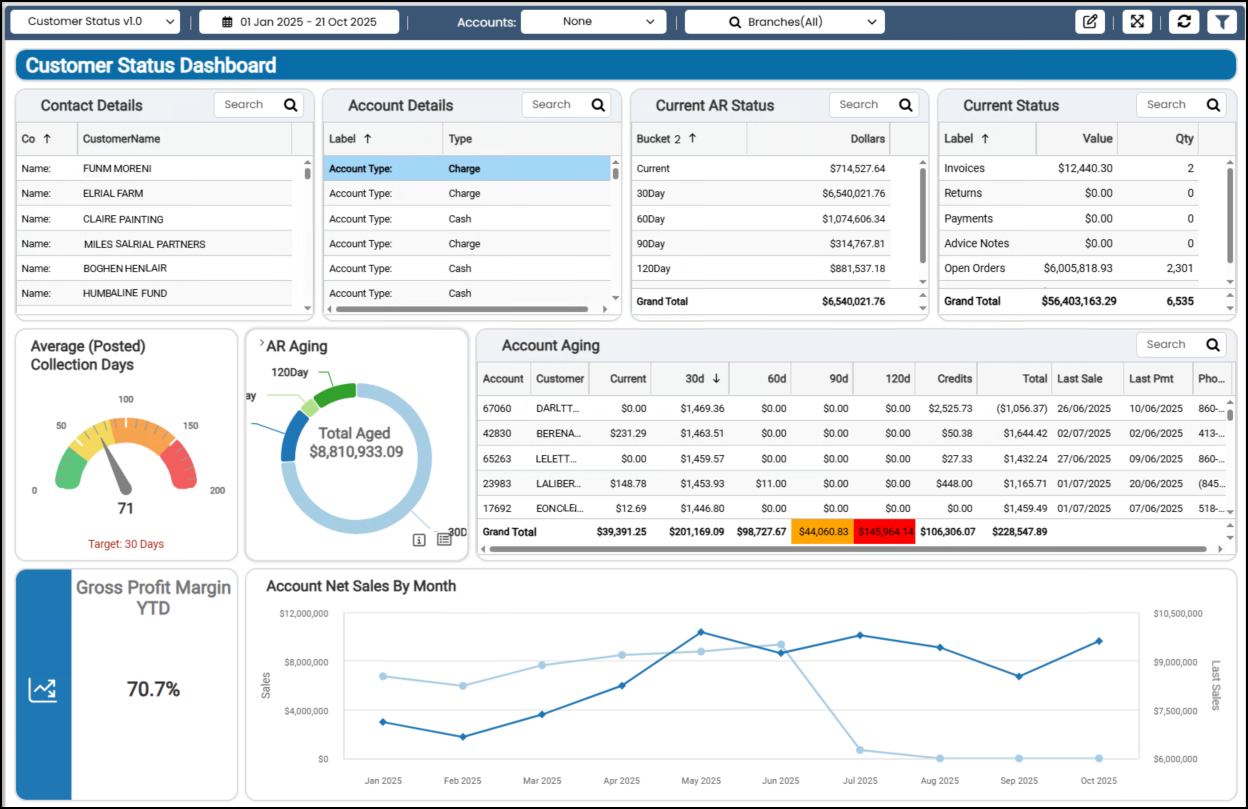
Reviewing the Customer Status Dashboard
The Customer Status Dashboard has nine widgets that show the business's current financial health as it relates to customer accounts. This dashboard is uniquely helpful for drilling down into specific customer accounts and provides contact information for discussions about their sales and payments over the last 30, 60, 90, and 120 days. You can see individual customers’ data in the context of the other customers you serve, and review gross margin and net sales for the current month. You can filter the widget data in this dashboard by:
-
Date Range (defaults to previous year)
-
Accounts (defaults to None)
-
Branches (defaults to All)
This information is particularly useful to Sales and Branch Managers who are responsible for working with customers and discussing their account and product needs.
Customer Status Dashboard
Account Aging (Detail) Widget (Customer Status Dashboard)
Widget Name: Account Aging
View Name: COG_VW_AccountAging
Historical: No
Drill-Down: None
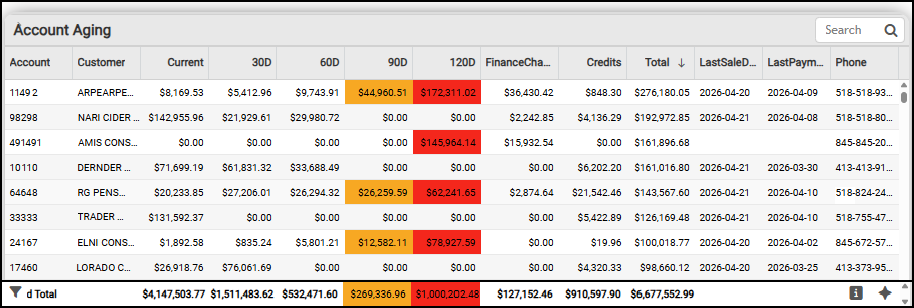
The Account Aging table widget displays your current customer list and the status of each customer's account. It is a useful tool for conversations because it contains all the relevant information to discuss the account’s status.
This list contains the account ID, name, current balance, 30, 60, 90, and 120-day balances, the outstanding finance charges, credits, and the total outstanding amount. This table displays the grand totals at the bottom by aging amount.
Accounts Receivable Dashboard > Account Aging List (by Account) Widget
You can filter this information by each of the standard aging buckets, by account, by credits, by customer class, by finance charges, by last sale and last payment dates, by sales representative, by aging total, and by user ID information. Selections in the Dashboard Account list do not impact this widget.
Account Details Widget (Customer Status Dashboard)
Widget Name: Account Details
View Name: COG_VW_AccountDetails
Historical: No
Drill-Down: None
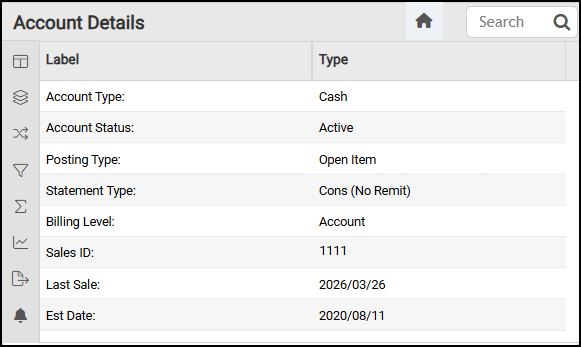
The Account Details table widget shows you the account details of the account you select from the Dashboard Accounts list, including the account type, the account status, the posting type (Balance Forward or Open Item), the account statement type, the billing level, the Sales ID, if applicable, the last sale date, and the date the account was established.
Customer Status Dashboard > Account Details Widget
The AI Insights for this widget might include:
-
Business Interpretation:
“The temporal range for 'Est Date' (Account Established Date) is extensive, spanning from <month/year the business was started> to <current month year>, indicating a long history of customer acquisition. Similarly, 'Last Sale' dates range from <earliest customer sale month/year> to <current month/year>, reflecting ongoing sales activity over two decades. The presence of null values for both date fields suggests either incomplete data or specific account types where these dates are not applicable.” -
Potential Business Decisions:
“Enhance Account Lifecycle Management: Investigate accounts categorized under 'Hold', 'Disabled', or 'Inactive' statuses to identify patterns. This could inform strategies for re-engagement with dormant customers, or trigger a formal archival process for truly closed accounts to streamline active customer lists. “ -
Suggested Follow-Up Questions:
“What is the overall count of all unique Account Status types available?”
You can filter this table using account information, customer class, sales representative, and user ID.
Account Net Sales by Month Widget (Customer Status Dashboard)
Widget Name: Account Net Sales By Month
View Name: COG_VW_NetSales
Historical: No
Drill-Down: None
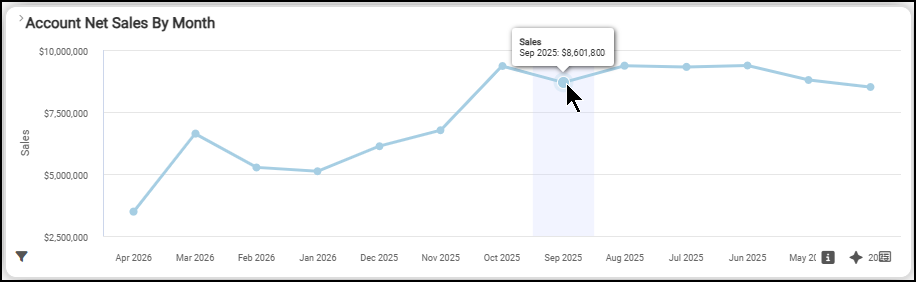
The Account Net Sales by Month line chart widget shows the net sales amounts, beginning with the same month of the prior year and including the current month-year. Net sales include cash and charge sales minus any returns and applicable taxes. This table uses the branch totals and the monthly summary values as data sources.
Sales Dashboard > Account Net Sales by Month Chart
The table presents the data numerically and compares the year-to-date grand total with last year’s sales.
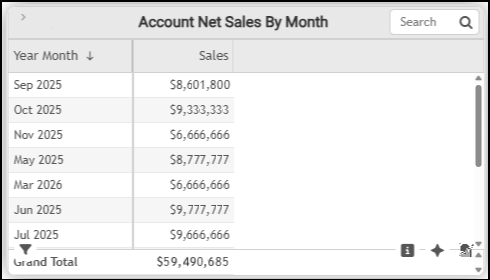
Sales Dashboard > Account Net Sales by Month Table
The AI Insights for this widget might include:
-
Business Interpretation:
“Sales Performance Overview: The provided data shows monthly net sales figures spanning from <next month of prior year>to <current month of current year>, revealing significant fluctuations within this period.” -
Potential Business Decisions:
“Analyze Sales Performance by Branch: To gain a deeper understanding of where sales strengths and weaknesses lie, review the performance of individual branches, especially during both peak and off-peak seasons, to identify best practices or areas needing improvement.” -
Suggested Follow-Up Questions:
“What were the total sales contributions from different payment types, such as cash versus charge sales, during the months with the lowest overall sales?”
You can filter this data by branch ID and by the previous year's net sales, including cash credits, cash sales, charge credits, charge sales, and taxes.
AR Aging Widget (Customer Status Dashboard)
Widget Name: AR Aging Donut v1.0
View Name: COG_VW_Currentarstatus
Historical: No
Drill-Down: None
The Accounts Receivable Aging donut widget summarizes the past-due receivables balances for each aged period (30, 60, 90, and 120 days). It does not include finance charges, credit balances, or the current customer balance. The chart also displays the total aged amount in the center.
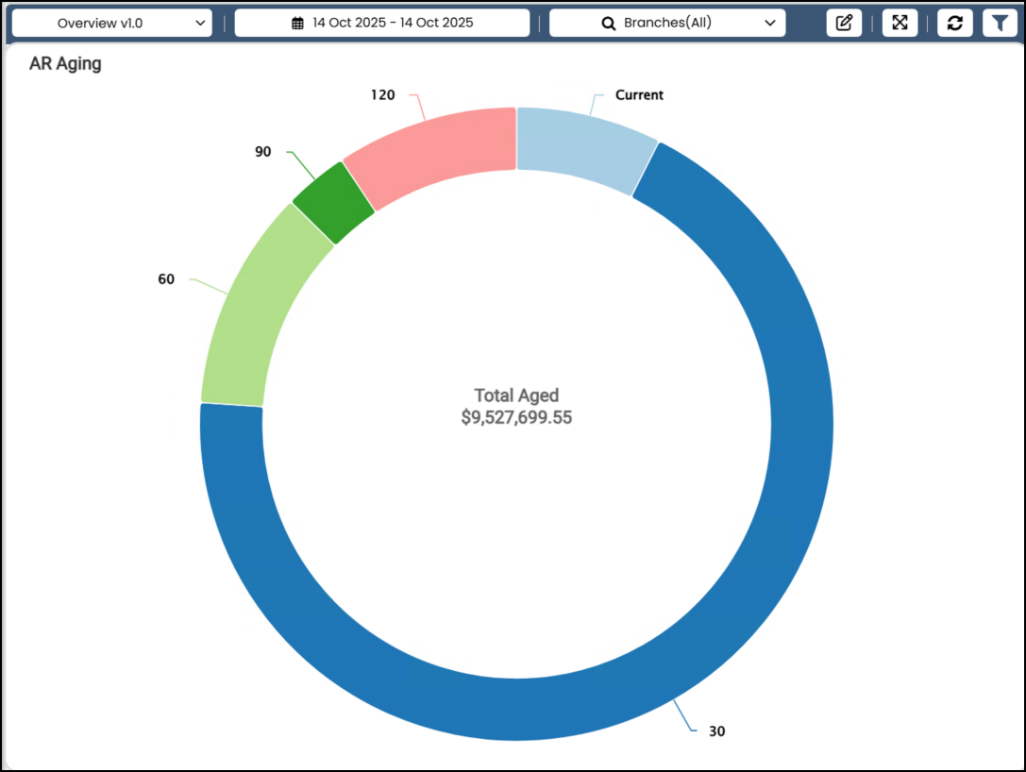
Customer Status Dashboard > AR Aging Widget Chart
By selecting the List View  icon, you can see the aged balance amounts for each date range and the total aging amount.
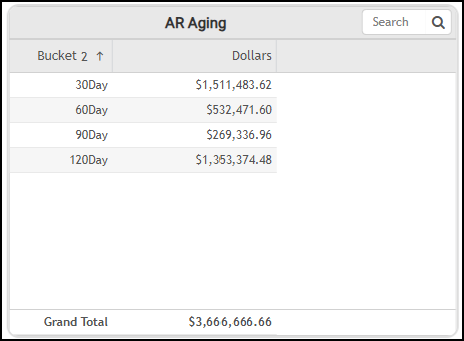
Accounts Receivable > Aging Balances by Bucket with Total
The AI Insights options for this widget include:
-
Business Interpretation:
“The Accounts Receivable (AR) aging analysis reveals that the largest current outstanding balance, totaling <amount>, falls within the <bucket number> bucket. This indicates a healthy portion of recent invoices.” -
Potential Business Decisions:
“Prioritize immediate collection efforts on the accounts in the <latest bucket> overdue bucket to recover the substantial <amount> and mitigate the risk of these funds becoming uncollectible.” -
Suggested Follow-Up Questions:
“What are the individual customer accounts that constitute the <latest bucket> overdue amount, along with their respective balances?”
You can filter this data by account, bucket, amounts, percentages, sums, and user ID settings. This widget does not change based on the Dashboard Accounts filter settings.
Average (Posted) Collection Days Widget (Customer Status Dashboard)
Widget Name: Avg AR Collection Days Gauge v1.1
View Name: COG_VW_ARcollectionDays
Historical: No
Drill-Down: None
The Average (Posted) Collection Days gauge widget shows the average number of days required for customers to collect payments on your receivables accounts, based on an aggregate of the posted payment amounts. We calculate this value by summing the customer’s current balances and dividing by the average sale charge over the last 365 days. The number of days at the bottom of the chart updates as the application calculates the value. The target for this graph is 30 days.
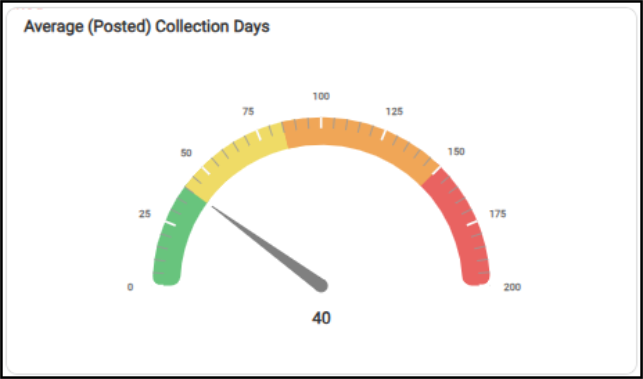
Accounts Receivable Dashboard > Average Posted Collection Days
The AI Insights options for this widget might include:
-
Business Interpretation:
“The average collection period for accounts receivable across the business is approximately <number of days>.”
-
Potential Business Decisions:
“*Assess Payment Terms Alignment:* Compare this <day quantity>-day average against standard credit terms offered to customers (e.g., Net 30). If significantly higher, it suggests a need to re-evaluate payment incentives or collection strategies for overdue accounts.” -
Suggested Follow-Up Questions:
“What is the average collection period for each of our Accounts Receivable branches?”
You can filter this list by account, branch details, customer class, sales representative, actual date, and user ID information. This table does not change based on selections in the Dashboard Account list settings.
Contact Details Widget (Customer Status Dashboard)
Widget Name: CustomerStatus
View Name: COG_VW_CustomerStatus
Historical: No
Drill-Down: None
The Contact Details widget provides a quick way to find the contact name for each business, so you can address account payment questions.
Begin by selecting an account from the Dashboard filter to display the customer account details, including the name, company, address lines, city, state, postal code, and phone number. This does not show the contact details for an account and associated jobs, just the primary account values.
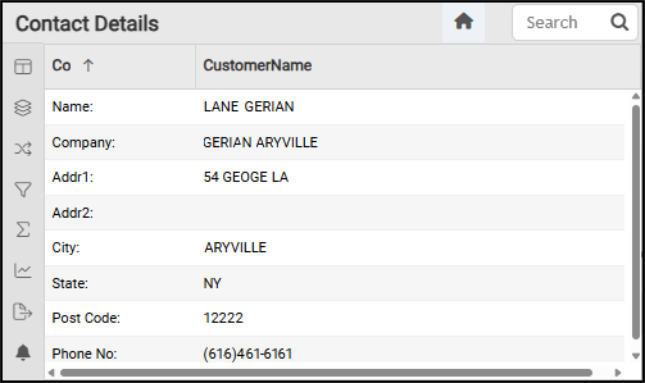
Customer Status Dashboard > Contact Details Table
The AI Insights that might be available for this widget include:
-
Business Interpretation:
“The provided dataset offers a comprehensive list of customer entities, showcasing a diverse range from individual clients (e.g., <account contact>, <account contact>) to various business structures such as Limited Liability Companies (LLCs), corporations (Inc., Corp.), and even public sector or non-profit organizations (such as, <account contact>, <account contact>).” -
Potential Business Decisions:
“To maximize value from this extensive customer list, it is advisable to implement a robust customer segmentation strategy. Classifying customers into groups like 'Individual Homeowners', 'Small Contractors', 'Large Construction Firms', 'Retailers', and 'Public Sector' will allow for highly targeted marketing campaigns, tailored pricing models, and customized service offerings, directly aligning with the specialized demands of the LBM industry.” -
Suggested Follow-Up Questions:
"Could you provide the full contact information, including the account number, address line, city, state, and postal code, for <account>?"
You can filter the entries in this list by account information, customer class, sales representative, and user ID.
Current AR Status Widget (Customer Status Dashboard)
Widget Name: Customer AR Balance
View Name: COG_VW_Currentarstatus
Historical: No
Drill-Down: None
The Current Accounts Receivable Status table widget displays the aging buckets as a percentage of the total payments received. This widget includes credits and finance charges, as applicable. The Buckets and Dollars columns show how much is owed by the number of days since the first invoice, as well as the outstanding credits, for the selected accounts. The Grand Total shows the total amount customers owe as of today. This widget uses the same view query as the Accounts Receivable Current AR Status widget.
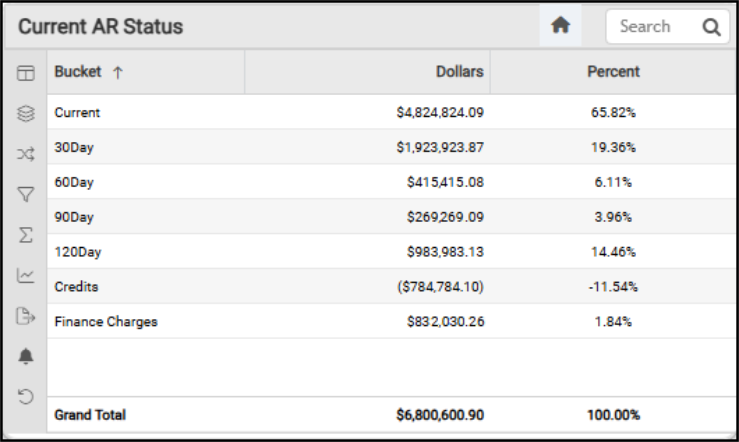
Customer Status Dashboard > Current AR Status Table
The AI Insights options for this widget include:
-
Business Interpretation:
“The current accounts receivable (AR) balance stands at a robust <amount>, representing <percentage> of the total AR, which is a positive indicator of effective initial payment cycles and overall liquidity.” -
Potential Business Decisions:
“Initiate immediate, targeted collection efforts for accounts falling into the <last bucket> overdue category to mitigate further risk of bad debt and improve cash flow. This requires a focused strategy on these high-value, high-risk accounts.” -
Suggested Follow-Up Questions:
“Which specific customer accounts hold the largest overdue balances in the <last> bucket?”
You can filter this list by account, bucket, amounts, percentage (of the current AR status), sum of dollars and percentages, and user ID settings.
Current Status Widget (Customer Status Dashboard)
Widget Name: Current Status All
View Name: COG_VW_CurrentStatusall
Historical: No (Current Values and MTD in some cases)
Drill-Down: None
The Current Status table widget reflects the total values for various types of documents related to customer activity. Here you see the current accounts receivable records, specifying amounts and quantities for open orders, open quotes, debit adjustments, open credit adjustments, open credit memos, open invoices, open payments, plus thirty-day invoices and thirty-day returns. The grand total entry shows the value and total quantity of the outstanding documents. The total values for various types of customer activity. The values in this widget are not based on the Dashboard filters, so they don't change when you change the dashboard settings.
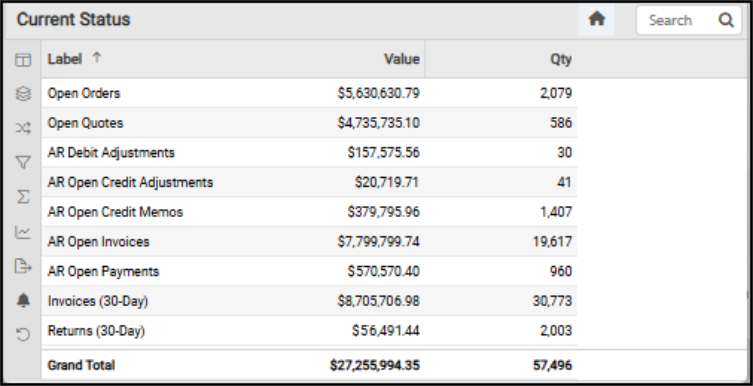
Current Status Dashboard > Current Status Widget
Here are the descriptions of the values shown for each label type:
-
Invoices: This amount reflects the sum of the Invoice Totals (including tax) for the current month. Only includes types 1 and 4 invoices (invoice and direct ship) from the Invoices Header table. This value does not include installed sales, open tickets, charge returns, or canceled invoices. This amount also includes the net of any negative invoices. Adds the balance remaining due for charge invoices that were paid via "charge" and have not been fully paid (only relevant for open item accounts).
-
Returns: This amount reflects the sum of unapplied Open Credits of type "Credit Memo" (Credit Type 3) with an Entry Date (Open Item, not Document) in the current month. Does not include all returns, such as applied credit memos or negative non-charge invoices. These values are collected from the Open Credits (OpenCredits) and Documents table.
-
Payments: This amount reflects the sum of unapplied Open Credits of type "Payment" (Credit Type 0) with an Entry Date (Open Item, not Document) in the current month. This does not include non-receivable payments, such as deposits. Uses the Open Credits (OpenCredits) and Documents table.
-
Open Tickets (Advice Notes): This amount reflects the sum of the Subtotals (pretax) for Open Tickets where the Document Entry Date month matches the current month, which could include prior years. This value only includes type 0 invoices (Open Tickets) and is based on the Invoices Header table (InvoicesHdr).
-
Open Orders: This amount reflects the sum of the Extended Amounts (not including adjustments) for Order Details (Items/BOM) with a Remaining Quantity not equal to zero on all Customer Orders (OrderType=0) that are currently open. This amount does not include Direct Ship orders or quotes. There is no date limitation on this value. This uses data from the Orders Details (OrdersDtl, OrdersHdr, and Documents tables).
-
Open Quotes: This amount reflects the sum of the Extended Amounts (not including adjustments) for Quote Details data (Items/BOM) with a remaining quantity not equal to zero on all customer Quotes (OrderType=1) that are currently open. There is no date limitation on this value. This uses data from the Orders Details (OrdersDtl, OrdersHdr, and Documents tables). This table contains both quote and order data.
The AI Insights for this widget might include:
-
Business Interpretation:
“Dominant Open Invoices and Recent Sales: Our Accounts Receivable currently shows a substantial balance of <label name> totaling <amount> across <document quantity> items, indicating a significant amount of outstanding payments from customers. Complementing this, <document label name> recorded an impressive <amount> from <quantity> transactions, highlighting robust recent sales activity.” -
Potential Business Decisions:
“Optimize Cash Flow from Open Invoices: Implement a focused strategy to accelerate collections for the high value of <label name>. This could involve targeted communication, revised payment terms for specific customer segments, or leveraging automated reminders to improve cash flow.” -
Suggested Follow-Up Questions:
“What is the combined outstanding value across all open Accounts Receivable items, taking into account both open invoices and open credit memos?”
Gross Profit Margin Year-to-Date Widget (Customer Status Dashboard)
Widget Name: Gross Profit Margin v1.0
View Name: COG_VW_Profitmargin
Historical: Yes
Drill-Down: None
The Gross Profit Margin headline widget is one of the most important indicators of the success of your company in the current year. It shows the year-to-date (YTD) gross profit margin percentage for the selected customer account; if an account is not selected, it shows the overall gross profit margin.
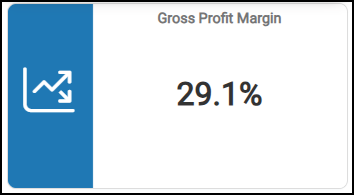
Customer Status Dashboard > Gross Profit Margin Chart
You can filter this widget by branch settings, cost of goods sold, gross margin, product group settings, primary vendor settings, sales, and year/month settings.
See Also:
Working with Cognytics Dashboards
Current Dashboard List