Reviewing the Customer Retention Dashboard (Cognytics)
The Customer Retention Dashboard displays eight widgets that combine new- and existing-business sales data to provide an overview of year-to-date changes. You can drill down into customer gains and losses by account and salesperson to monitor new account purchasing trends.
You can filter the widget data in this dashboard:
-
By Date Range (defaults to the current calendar year)
-
By Account
This is most useful to Branch and Sales Managers, and some information could be shared with Purchasing and Inventory Managers.
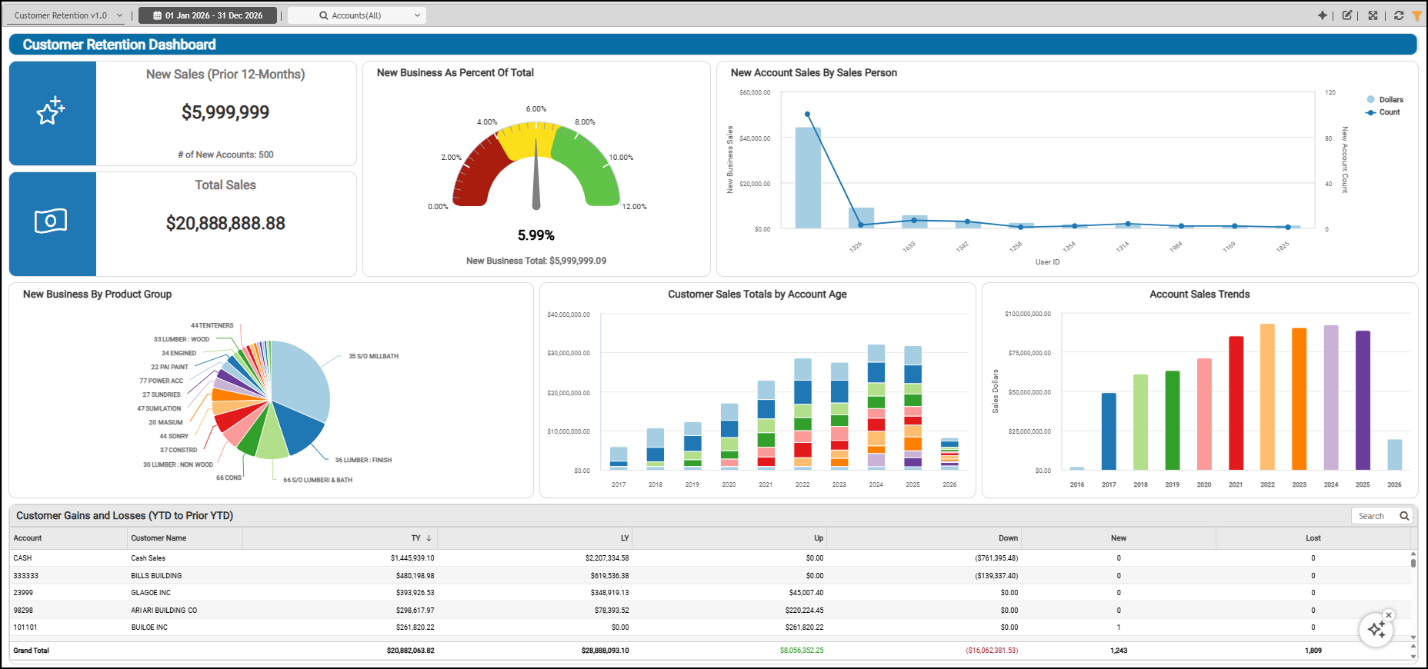
Customer Retention Dashboard
Account Sales Trends Widget (Customer Retention Dashboard)
Widget Name: Class of Year v1.0
View Name: COG_VW_Classofcycle
Historical: No
Drill-Down: None
The Account Sales Trends column/bar chart lists the total sales grouped by year. This widget includes all accounts receivable sales for the period and shows the total by year if you hover over a column. This calculation excludes cash sales.
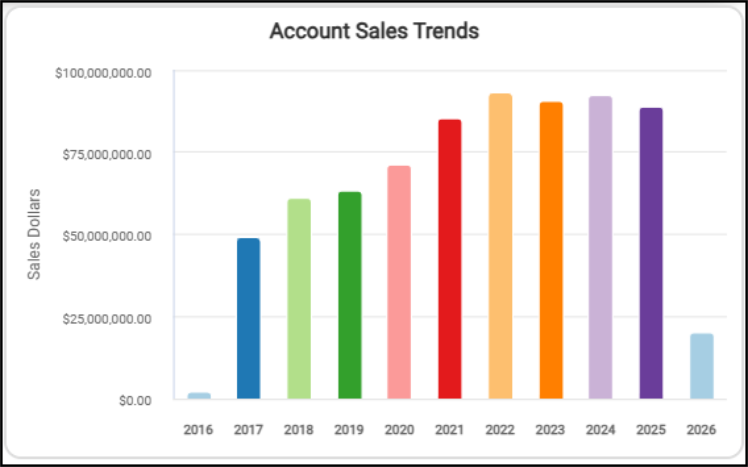
Customer Retention Dashboard > Account Sales Trends Widget
When you switch to the table view, you see the sales totals for each year and the sales grand total for all listed years.
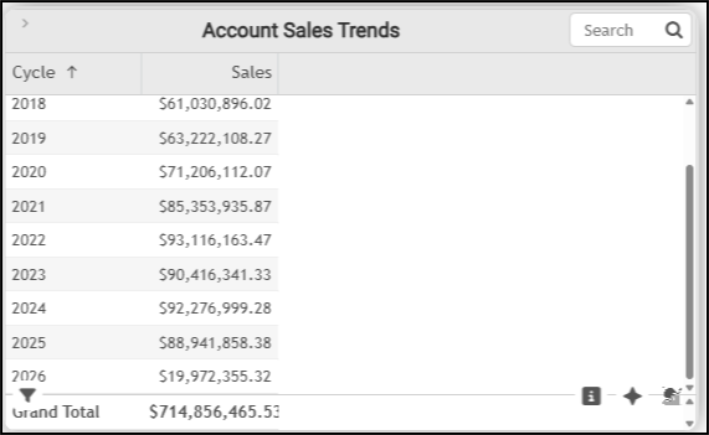
Customer Retention Dashboard > Account Sales Trends Table
The AI Insights options for the Account Sales Trends widget include:
-
Business Interpretation:
"Key Insights & Trends: There was a very strong and consistent growth trend in sales from <year> through <year>. The initial <sales amount> sales in <year> likely represent a system initialization or the start of tracking for this 'Class of (Year)' dimension.”
-
Potential Business Decisions:
“Capitalize on Peak Performance Factors: Conduct a detailed investigation into the strategies, market conditions, and operational efficiencies that contributed to the record sales performance in <year>. Identify and document best practices from this period in areas like sales, marketing, and inventory management for potential replication and scale.”
-
Suggested Follow-Up Questions:
“Could we examine the individual sales contributions of each account during the peak performance year of <year>?”
You can filter this list by account information, class (year), customer class, date the accounts were established, sales representative, and user.
Customer Gains and Losses (YTD to Prior YTD) Widget (Customer Retention Dashboard)
Widget Name: Customer Gains and Loss Account Details v1.0
View Name: COG_VW_Customergainsandlossaccountdetails
Historical: No
Drill-Down: None
The Customer Gains and Losses table widget compares the total sales gains and losses by account ID/Customer Name for the year-to-date and the entire prior year. This means that if you review this table in January, it would compare January's sales to the entire prior year (January - December). Additionally, this table shows how much more or less.
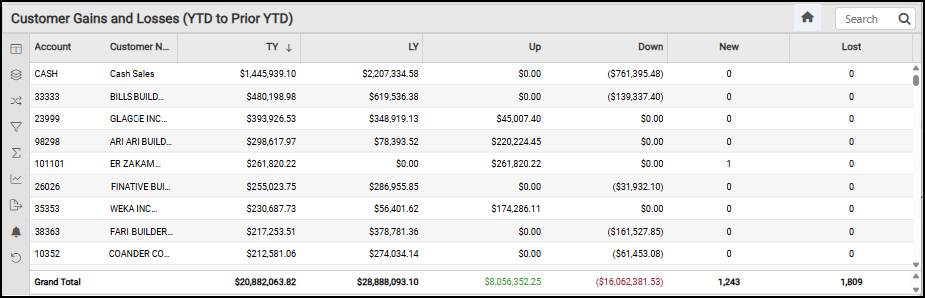
Customer Retention Dashboard > Customer Gains & Losses (YTD to Prior YTD) Table
The columns in this table show the changes in totals (up or down) for each customer, based on their sales for the period (excluding tax). The columns reflect:
-
TY {This Year}
This amount reflects the SUM of the Sales for the current calendar year -
LY {Last Year} This amount reflects the SUM of the Sales for the previous calendar year
-
Up This amount reflects the difference between the current and previous calendar year's Sales when the result is positive (meaning that, so far, there are more sales this year than last).
-
Down This amount reflects the difference between the current and previous calendar year’s Sales when the result is negative (meaning that, so far, there are fewer sales this year than last)
-
New This amount reflects the SUM of the current year's Sales when there were no sales in the previous year.
-
Lost This amount reflects the SUM of the previous year's Sales when there are no Sales in the current calendar year.
You can filter this data by account, customer class, the up, down, last year, this year, new, and lost columns, and by sales representative.
Customer Sales Totals by Account Age Widget (Customer Retention Dashboard)
Widget Name: Customer Retention v1.0
View Name: COG_VW_Customerretention
Historical: No
Drill-Down: Table
The Customer Sales Totals by Account Age stacked column widget shows how well the business retains customers over time. This chart groups customers by the number of years since they opened an account at your store(s). Further, this chart lists the dollar amount of sales by group age for each year. The newest accounts are at the top of each column, and the list gets older as you go down the column. As you scroll down the list, you see the cycle and the number of sales in that cycle. This calculation excludes cash sales. This table is restricted to the last ten years.
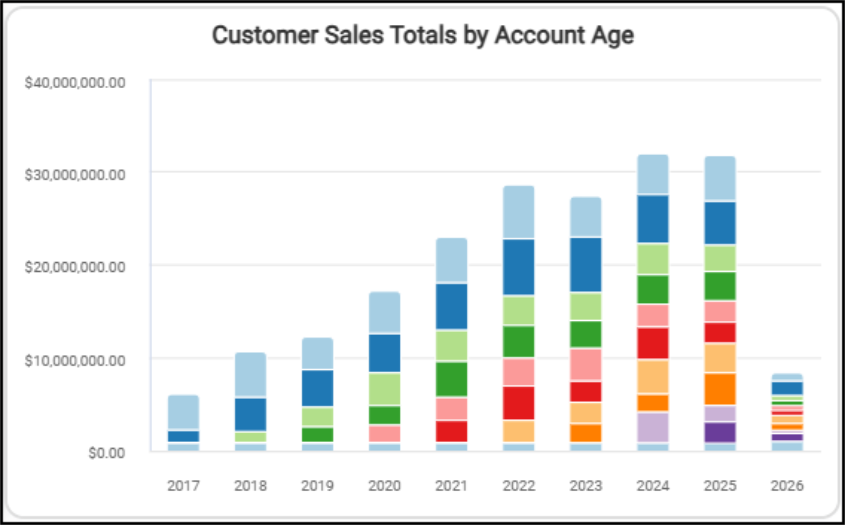
Customer Retention Dashboard > Customer Sales Totals by Account Age Chart
The table lists the data by year and shows sales by account age for each year.
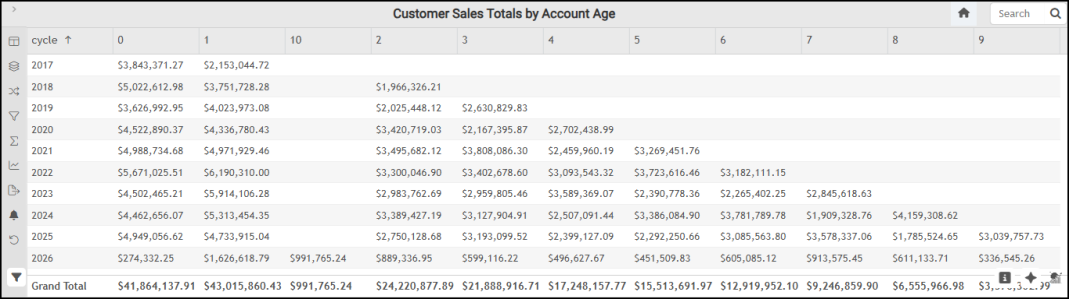
Customer Retention Dashboard > Customer Sales Totals by Account Age Table
The AI Insights tabs for the Customer Sales Totals by Account Age widget include:
-
Business Interpretation:
“Top Performing Account Age Segments: The data indicates strong sales contributions from customers in their first year of activity (column '1'), particularly in <year>, where this segment generated an impressive <amount>. Similarly, new customers (column '0') consistently contribute significantly, with a peak of <amount> in <year>.”
-
Potential Business Decisions:
“Optimize New Customer Engagement: Given the high sales from new customers (year '0') and customers in their first year (year '1'), focus on refining onboarding processes and initial service offerings to maximize their early spend and reinforce loyalty.”
-
Suggested Follow-Up Questions:
“What were the overall total sales for each year, considering all customer age groups?”
You can filter the Customer Sales Totals by Account Age data by account information, customer class (if set), sales representative, totals, user IDs, and years.
New Account Sales by Salesperson Widget (Customer Retention Dashboard)
Widget Name: New Account Sales by Salesperson v1.0
View Name: COG_VW_Newaccountsalesbysalesperson
Historical: No
Drill-Down: Table Only (User ID, Sales, Count)
The New Account Sales by Sales Person bar and line graph provides details on new account sales closed by each salesperson by user ID for the dashboard’s selected date range. Only accounts established within the selected period are included as “new”. The bar graph shows the amount of each salesperson’s sales, and the line graph shows the number of new accounts for that salesperson. You can hover over this chart to display the details of a particular salesperson by user ID.
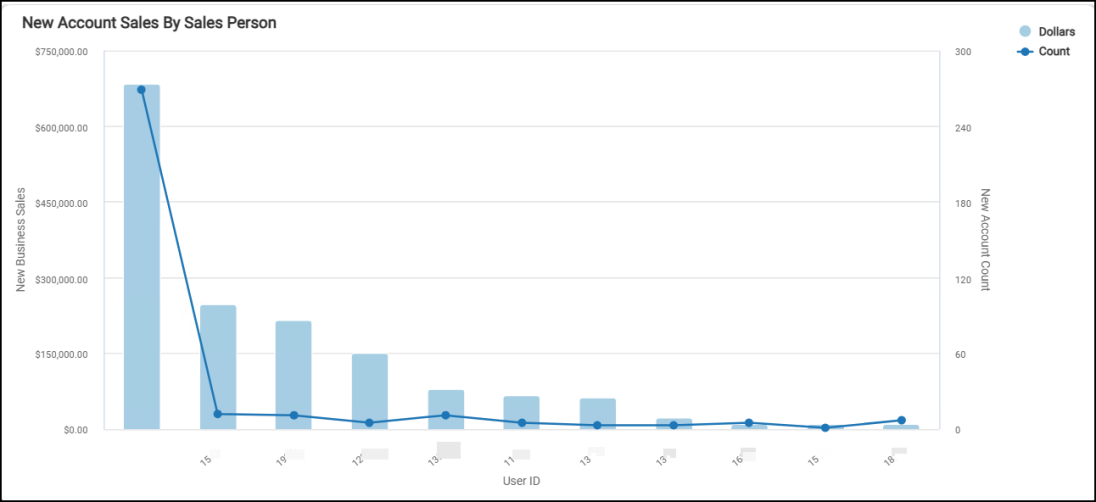
Customer Retention Dashboard > New Account Sales by User ID Chart
The table shows the dollar amount for each salesperson and the count of new accounts for each person.
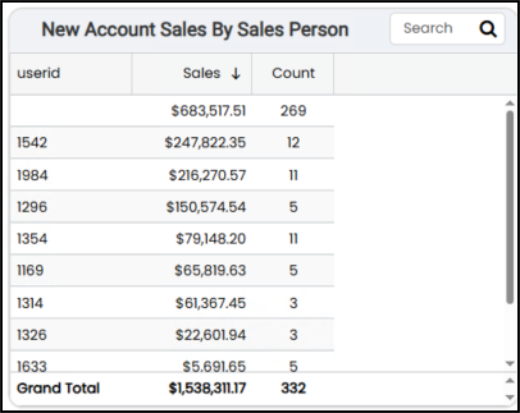
Customer Retention Dashboard > New Account Sales by Sales Person Table
You can filter the information collected by this widget by account, branch, customer class, salesperson’s name and user ID, and by account count.
The AI Insights for this widget might include:
-
Business Interpretation:
“Investigate Unassigned Sales: Prioritize understanding the nature of the sales associated with the empty salesperson ID. If these are indeed unassigned sales, implement procedures to ensure all new account sales are accurately attributed to a specific salesperson to gain clearer visibility into individual performance and accountability.”
-
Potential Business Decisions:
“The top entry, with an empty salesperson ID, represents the largest aggregate, accounting for '<amount>' in sales across <quantity> unique accounts. This could signify unassigned sales or a collective total, and its substantial contribution merits further investigation.”
-
Suggested Follow-up Questions:
“Can we see the total sales and number unique accounts for each salesperson broken down by branch?”
New Business as Percent of Total Sales Widget (Customer Retention Dashboard)
Widget Name: New Business Total Sales v1.0
View Name: COG_VW_Newbusinessaspercentoftotal
Historical: No (Current year only)
Drill-Down: Yes (Account #, Account Name, Sales, Account Created Date, and Last Purchase Date)
The New Business Total Sales gauge widget measures total sales from new business accounts added, since the beginning of the year (that is, accounts established in the prior 12-month period). The amount that displays shows the last purchase information for each new business. The last purchase amount at the bottom reflects the total for all new businesses added in the last 12 months.
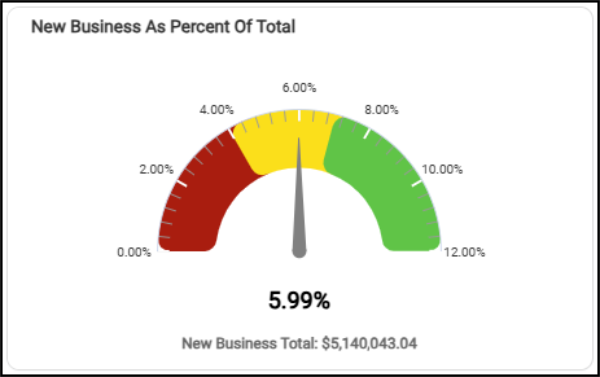
Customer Retention > New Business as Percent of Total Sales Gauge Chart
This widget can be filtered by account and by date changes in the dashboard settings. If you choose the AI Insights icon, you might get these types of prompts:
-
Business Interpretation
“The analysis indicates that 'New Business' currently accounts for approximately <percentage> of the total business. This metric provides a high-level snapshot of the proportion of revenue or sales generated from newly acquired customers or ventures.>"
-
Potential Business Decisions
“Assess Customer Acquisition Strategies: Evaluate current marketing and sales efforts aimed at attracting new customers. Given that new business makes up a small fraction of total sales, there may be opportunities to refine or expand these strategies.”
-
Suggested Follow-Up Questions
“How does the percentage of new business vary across different branches or locations?”
You can filter the data in this widget by account information (including the AR branch), new business date, customer class, last sale date, sales representative, total sales, and user information.
New Business by Product Group Widget (Customer Retention Dashboard)
Widget Name: New Business by Product Group v1.0
View Name: COG_VW_newbusinessbyproductgroup
Historical: Yes
Drill-Down: Table (Group Code -Description, Amount, Descending Order)
The New Business by Product Group pie chart widget shows you the distribution (by Group code) of the products your new customers have purchased. This data is collected from the invoice header and detail tables, the inventory customer master, the group/section, and the document data tables. It includes Direct Ship and Installed Sales data, where applicable, and excludes canceled invoices and open tickets. These calculations do not include item returns or sales tax.
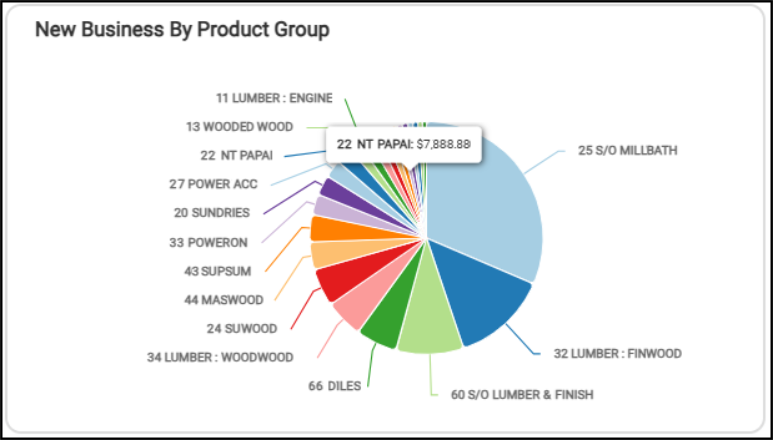
Customer Retention Dashboard > New Business By Product Group
When you hover over a specific entry in the pie chart, the item ID and the amount of revenue for the new business displays.
The table version includes the Grand Total for all the new business data.
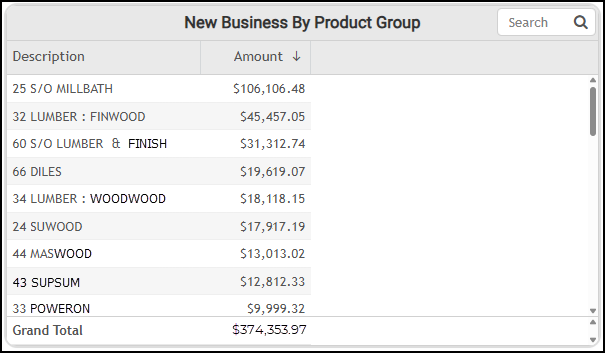
Customer Retention Dashboard > New Business by Product Group Table
The AI Insights for this widget might include the following prompts:
-
Business Interpretation:
“The product group <group ID group name> as a contributor to new business, generating a significant <amount>. This highlights the substantial value derived from special-order <group name> projects.”
-
Potential Business Decisions:
Capitalize on High-Value Special Orders: Investigate the factors driving the success of <group ID group name> and <group ID group name>. Identify best practices in sales, quoting, and project management for these categories and explore opportunities to replicate them across other special-order or high-value product lines.”
-
Suggested Follow-up Questions:
“How has the new business amount for our top product groups trended over specific periods, such as month-over-month or quarter-over-quarter?”
You can filter this list by account, customer class, date, sales representative, amount, and user ID.
New Sales (Prior 12 Months) Widget (Customer Retention Dashboard)
Widget Name: New Business Total Sales v1.0
View Name: COG_VW_Newbusinessaspercentoftotal
Historical: Yes
Drill-Down: Yes (Account #, Account Name, Sales, Account Created Date, and Last Purchase Date)
The New Sales (Prior 12-Months) headline widget shows the number of new accounts and the total revenue from new sales for the previous 12 months (meaning, if the current month is March 2026, this widget shows the total number of new accounts and the total revenue for February 2025 to February 2026). This amount does not reflect “Cash” account sales and does not include sales tax.
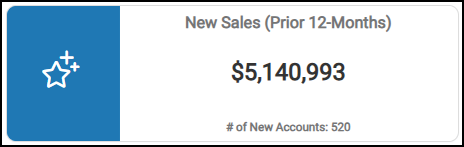
Customer Retention Dashboard > New Sales (Prior 12-Months) Widget
You can filter this data by account information (including AR Branch), customer date, and other customer-related data, sales representative data, and user information.
Total Sales Widget (Customer Retention Dashboard)
Widget Name: Total Sales V2.0
View Name: COG_VW_TotalSales v1.0
Historical: Yes
Drill-Down: None
The Total Sales Year-to-Date headline chart provides a cumulative view of revenue performance from the beginning of the fiscal year up to the current date (based on the dashboard's accounts and date range settings). This total does not include taxes and includes both account sales and cash-account sales.
Note: If you change the date range, make sure you include the first of the month as the first setting.

Customer Retention Dashboard > Total Sales (YTD)
This chart is useful for tracking progress against annual sales targets, identifying growth trends, and helping make informed business decisions. The widget filter contains the account, customer class, sales representative, and user options.
See Also:
Working with Cognytics Dashboards
Current Dashboard List