Adding Alerts to iDashboard
Alerts are event-based messages that you can send via SMS or email. You can decide how often the system checks the data against the thresholds you set. After you configure these thresholds, the system will automatically send the messages as the data triggers each threshold. Managers and others with administrative rights can configure these alerts. Sample alerts include:
-
Proactive warnings when specific inventory is low,
-
Warnings when a customer approaches 90% of their allowable credit limit, or
-
Notification when an account is 5 days from becoming 30 days past due, etc.
Alerts can also send praise and encouragement when something is going well, such as when an Account Manager or Salesperson hits a milestone for the month during a promotion or has achieved a specific annual target! You set the criteria for these alerts, and the system sends the notifications when the criteria is/are met.
Since you are configuring these alerts to provide proactive guidance to your team, they allow you to be ahead of the game rather than reacting to a lack of inventory or an account’s potential credit issue. It also helps you automatically acknowledge your team when they are doing great work and keeps them on track!
Finally, the Alert dashboard gives you a one-stop shop for tracking these notifications based on the data in your Spruce software. Using the Alerts Dashboard, you can stay on top of all the alerts Spruce is sending at all times.
Getting Started
For purposes of this document, we assume that you have completed the setup of iDashboard successfully and can access it from the Analytics menu option in Spruce.
First, ensure your team members have email and/or mobile carrier settings in the Analytics, iDashboard module. If you choose, the system can just display the alerts on a dashboard, but if you want the application to send email or text messages to team members, these settings are required for notification. Team members do not have to have iDashboard licenses to receive email and text messages from iDashboard.
Note: Most customers are set up with at least two iDashboard licenses, and there are two types of iDashboard licenses; one for viewers and one for administrators. The administrator’s ID must be set in the Maintenance > Database > Parameters > Analytics tab. Typically, your ECI Support team can set that up for you if you provide the administrator’s User ID.
Reviewing User's Contact Credentials
To use the alerts, you have to ensure that the employees you are trying to notify have email or cell phone
To review the user’s contact credentials:
1. From the Toolbar at the top, choose Analytics. The iDashboards Lobby displays.
Note: If you get an “Invalid data object” message, you are not set up as an iDashboards user. For assistance in setting up your iDashboard access, contact Support.
iDashboards Lobby
3. From the Lobby, choose Admin > Users to display the list of iDashboard-enabled users.
Note: If the users that you want to receive alerts are not in this list, please add them.
4. Click the Edit icon to display the user’s credentials.
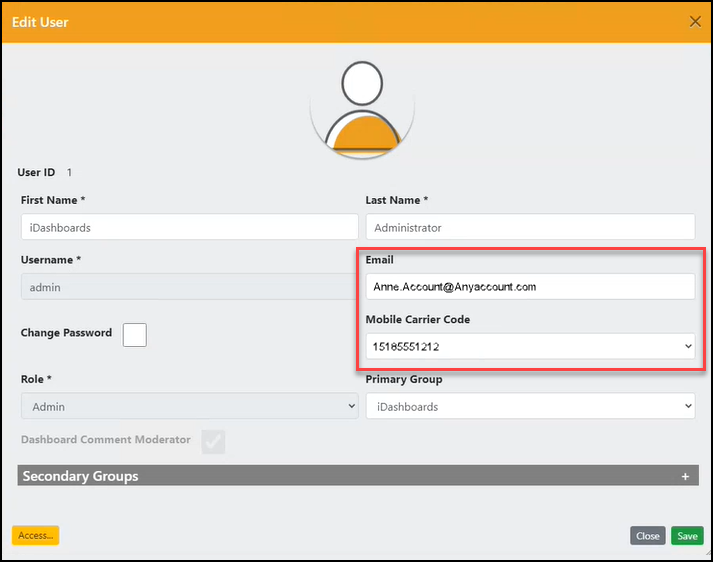
Edit User Form with Email and Mobile Carrier Code Fields Highlighted
5. Check the Email and Mobile Carrier Code fields to ensure these fields are complete. If they are not, add the email address and/or carrier information to the appropriate field.
6. Choose Save to ensure this data is complete.
7. Repeat steps 1 – 4 for each user that requires access to the alerts and reports you are running.
Next, we recommend you go to the Customer Portal and download the current Data Dictionary.
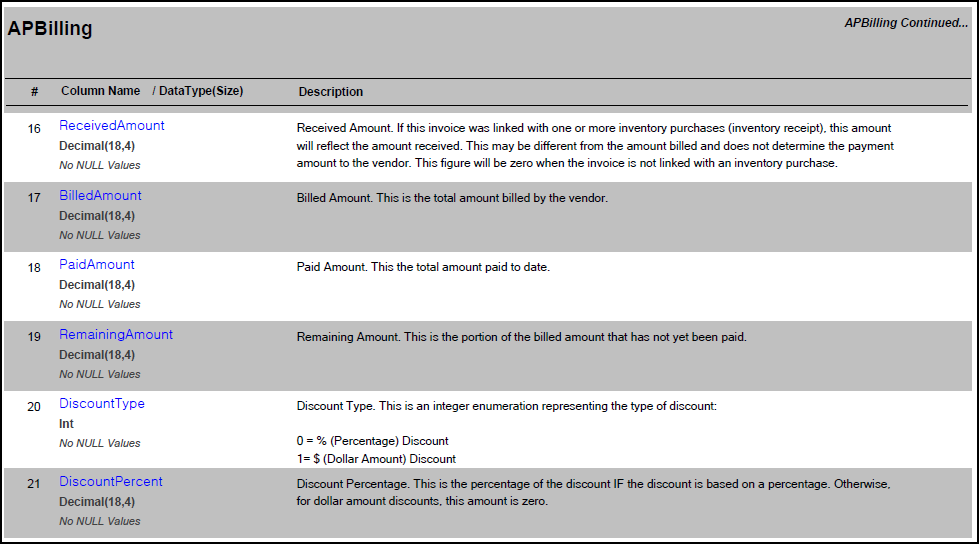
Data Dictionary Excerpt
The Data Dictionary lists the Spruce database tables and explains the definition of each column so you can choose data columns successfully. Use the Data Dictionary to understand the data elements available to you for building your alerts and reports. This ensures your alerts reflect the information you want to monitor. If you use the right data, your actions will be more meaningful.
How Do I Know if my Query is Going to Work?
The Data Conversion team can help you create or evaluate your team's queries.
-
If you are defining a query based on existing tables or charts, it is usually considered a simple query. The Data Conversion team can review this query and give you some coaching to help.
-
If you are defining a query that is not based on existing tables / charts or your query requires data from more than one database table, this query is more complex. The Data Conversion team can also help you create this query, but it will take longer.
Note: Any assistance the Data Conversion team provides in building these queries is billable at their discretion. We cannot guarantee that your query will work as you expect, but you can benefit from our experience.
Finding the Chart and Column for your Alert
Typically, when you develop an alert, you are trying to set a threshold for some information, so when the data in Spruce goes past that threshold, the Analytics module can send an alert to the appropriate person(s). You can set alerts for many reasons, such as for the amount of inventory in stock, the accounts almost past due, the current purchasing amounts, etc. Your Spruce data is most accessible in your Charts, which contain the data you use to set the threshold for the alert. So, the next step is to find the chart that contains the data you want to use to set that threshold.
iDashboard > View > Library
In the example below, we are searching for a chart that contains information about “dead inventory”. Our goal is to create an alert that sends a message when an inventory group reaches or exceeds 90% of dead inventory in the application data.
To find the chart you want to use to create your alert:
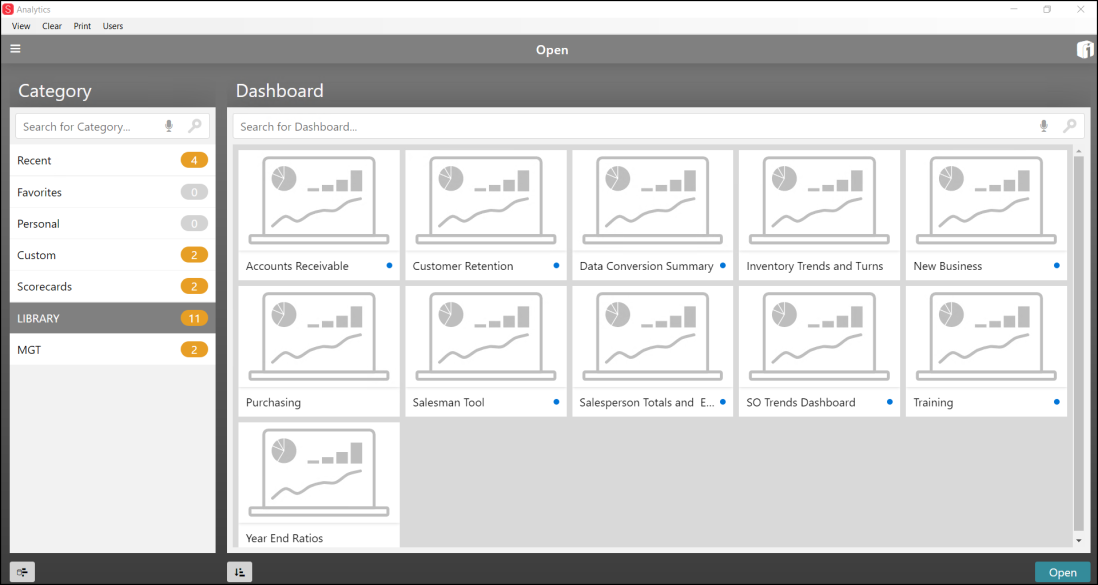
1. From the Lobby, choose View to display the Open page with the Category List and the Dashboard tab displaying.
2. From the Category list, choose the category (Recent, Library, MGT, etc.) that contains the data you want to use to define the alert. The Dashboard list updates to show the dashboards for that category.
3. Choose the dashboard containing the data you need to generate the alert.
Here, we are choosing MGT > Inventory, but you choose the Category and Dashboard with the needed data.

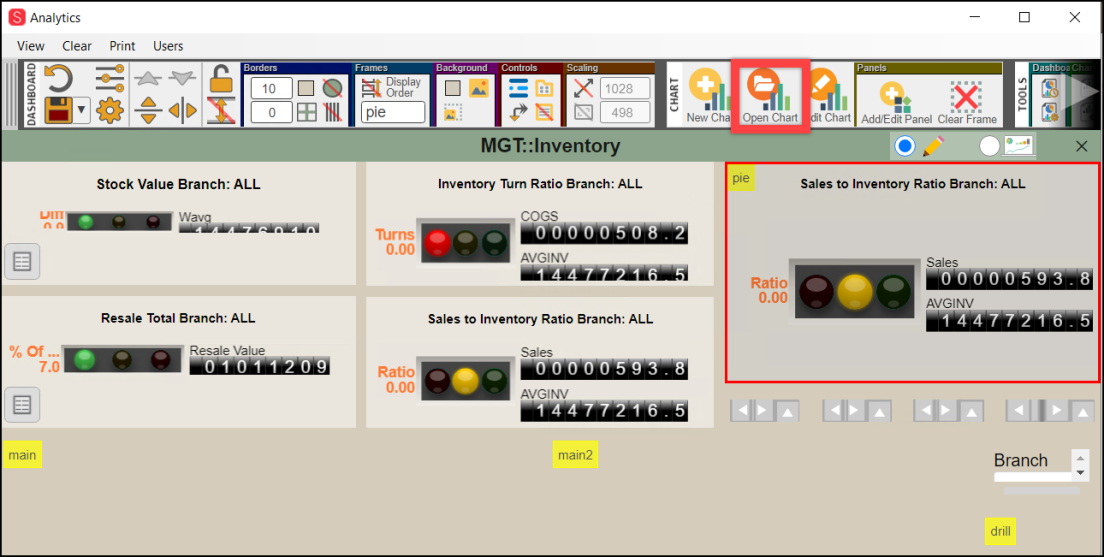
Management > Inventory Dashboard
The Management: Inventory Dashboard displays:
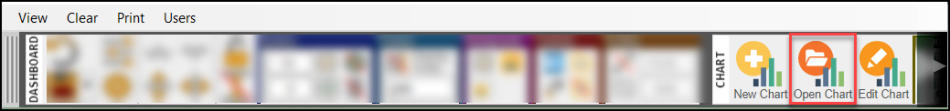
4. From the toolbar, choose Open Chart to display the Drag a chart into a frame box.
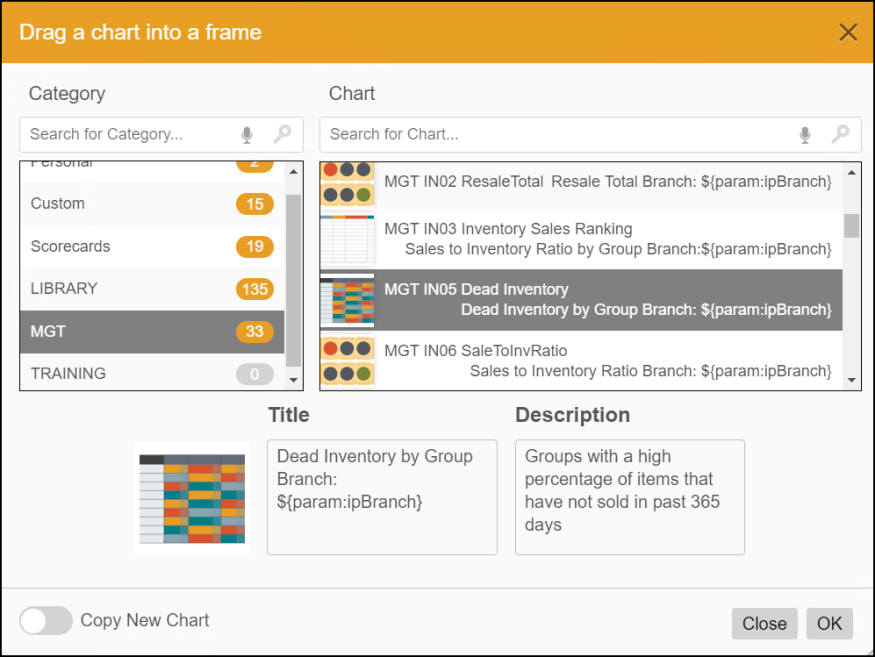
Drag a chart into a frame Box
5. Scroll through the charts associated with the selected category until you find one with the information you want.
Note: To learn more about the contents of a chart in the list, click it (as shown above) and review the description information.
6. When you find a chart that contains the data you need, click it and click OK to display the chart.
The Dashboard updates to display the chart you selected.
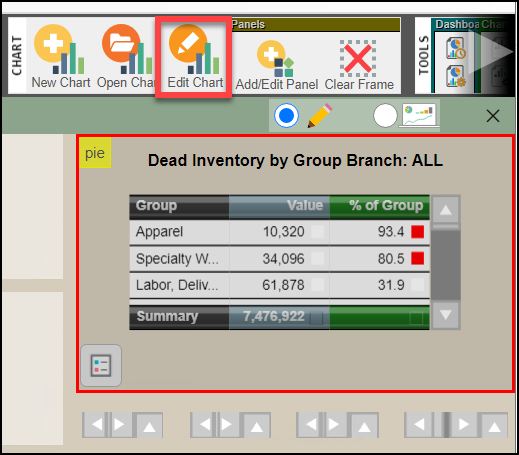
Dead Inventory by Group Branch: All
7. Make a note of the title of the chart. (Dead inventory by Group Branch: ALL, in this case).
8. From the Toolbar, choose the Edit Chart option to display the details of the chart.
The Chart Designer displays.
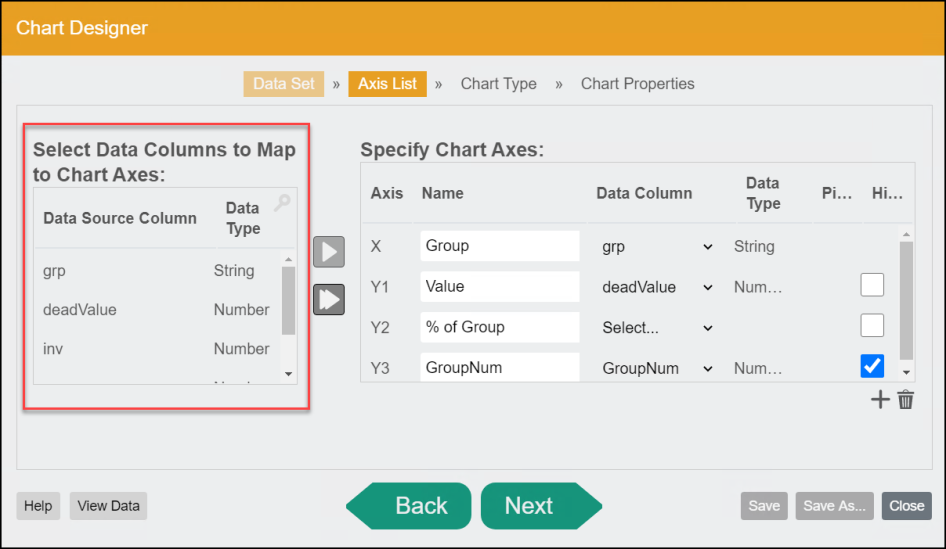
Chart Designer with Select Data Columns to Map Details Highlighted
9. Review the data source column entries to see if this is the data you are interested in creating the alert for.
Technical Note: For technical team members, click Back to review the query that generates the chart. It helps you evaluate whether you have the right data for the alert.
10. When you have identified the Data Source Column for the chart, note it and click Close (in the bottom right corner) to return to the Dashboard.
Dashboard with Chart
11. Choose the X in the Title bar to close the Dashboard.
Now that you have the chart’s name and the data source column you want to use to define the alert, you can create the alert from the chart.
If this data column is based on data in the Data Dictionary, it makes sense to look up this information to learn more about your chosen column.
Creating your Alerts from Charts
These instructions assume that you have administrative permissions set in iDashboard and have access to the charts you need to create the alert. It helps to clearly understand the information you are trying to collect from the alert.
To create an alert from a chart:
1. From the Lobby, choose Build > Chart tab. The list of charts displays.
2. In the Category list, choose the category that contains the chart you want to work with.
3. In the Chart tab, enter the first name of the chart in the field above the list. The Chart you are searching for displays at the top of the list.
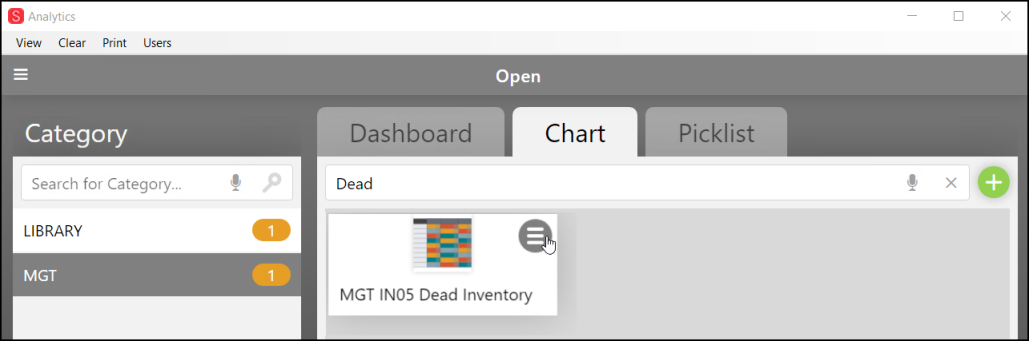
Build > Chart Tab
4. Click the Menu Marker  to display chart options.
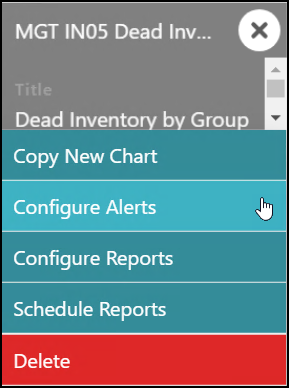
Chart Tab > Chart Selected > Context Menu
5. Choose Configure Alerts from the list. The Alerts box displays.
6. Choose New. The Configure a Chart Alert box displays.
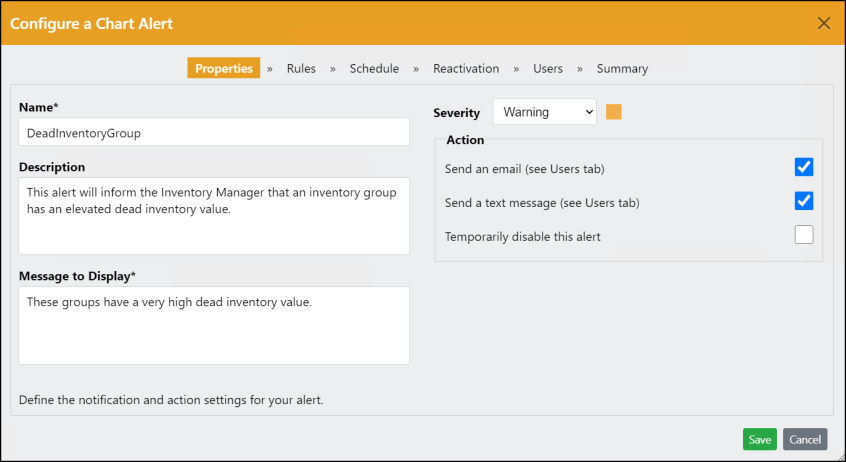
Configure a Chart Alert: Properties
7. On the Properties tab, enter the following information:
-
Name
Enter a name for the alert. This is the name that will display on the Alerts Dashboard. -
Description
Enter a description for the alert. -
Message to Display
Enter the Alert message that will display in the Subject section of the email alert or the text message section of the text alert.
Note: Email alerts provide the results of the alert query. The text message notifies the user that the alert has run. -
Severity
Choose the severity of the message. This informs the person who receives it how important the message is. Options include: Critical, Warning, Informational, Excellent. New severity options can be entered by administrators. -
Action
In this section, you choose how the alert is distributed.
Note: The alert results always display on the Alerts Dashboard.-
Send an email
Select this check box if you want iDashboard to email the person/group you choose in the Users tab. -
Send a text message
Select this check box if you want iDashboard to text the person/group you choose in the Users tab. -
Temporarily disable this alert
Select this check box if you want to disable this alert.
-
8. Click the Rules tab to define what the alert should measure.
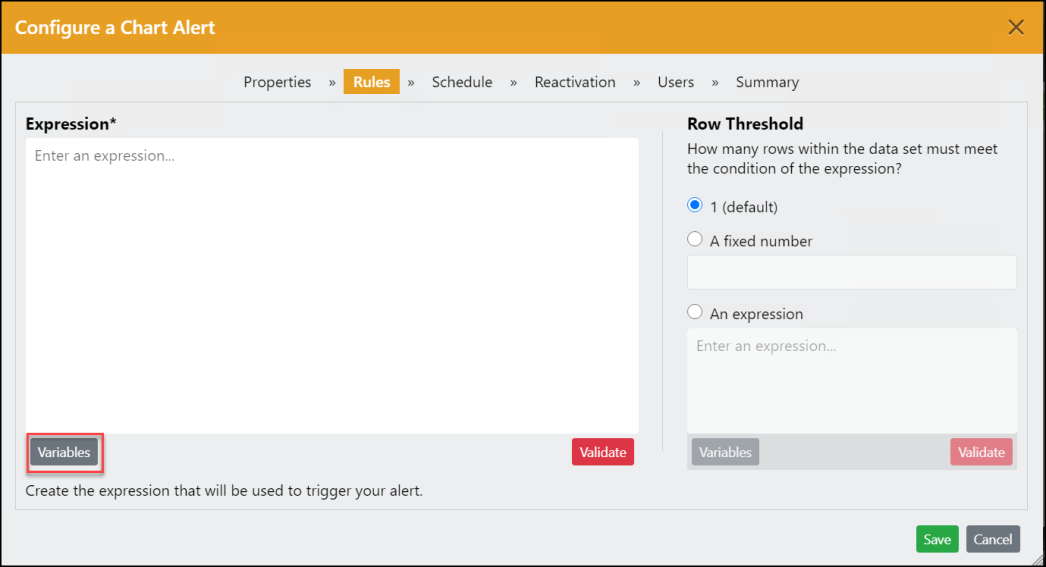
Configure a Chart Alert: Rules Tab
9. Click the Variables button to display the fields we saw in the Dashboard tab.
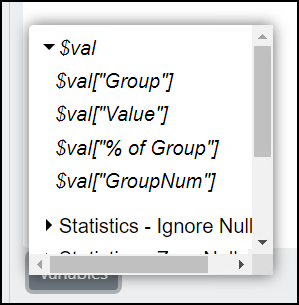
This list contains the columns in the chart, so you can choose the value you want to monitor for the alert. In our case, we want to monitor the % of Group value.
10. Click the value in the list you want to monitor in the alert. The expression updates to reflect your selection.
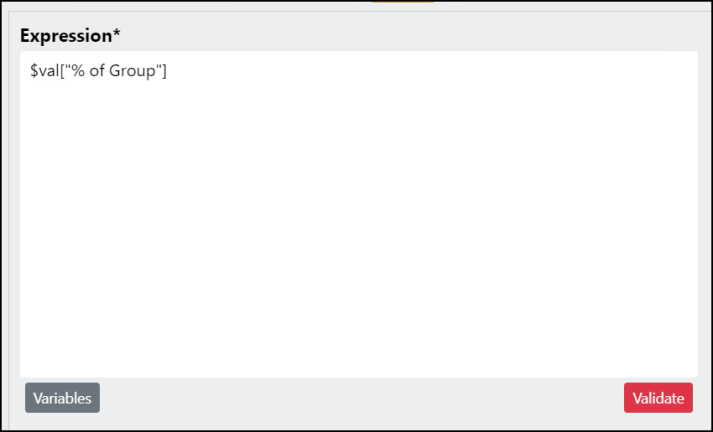
Configure a Chart Alert: Rules Tab with Expression Variable Added
11. Next, specify the value this field should have or exceed to trigger the alert and click Validate. iDashboard reviews your entry to see if the math is valid.
In our case we want this alert to trigger when the % of Group is more than 90% of dead inventory.
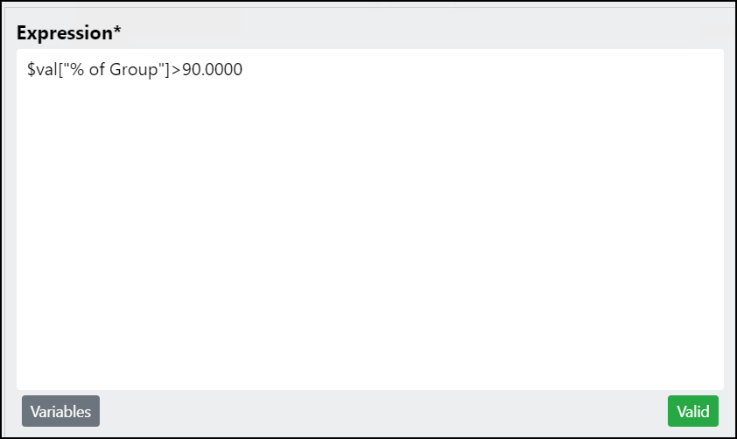
Configure a Chart Alert: Rules Tab with Validated Expression
12. To schedule the alert, choose the Schedule tab.
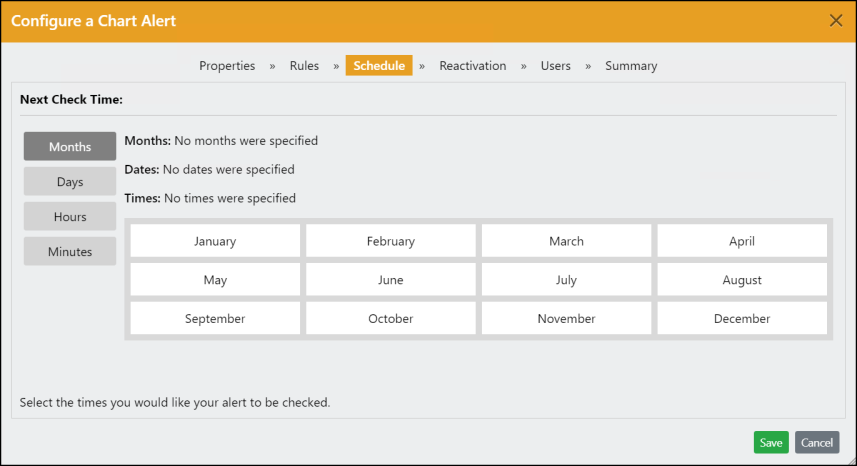
Configure a Chart Alert: Schedule Tab
13. Here, you choose when iDashboard should run the process and send the alert. You can set the number of months, the day of the month, the hour of the day, and the minutes, if necessary. The Months button is selected by default.
Note: Consider how much data processing the query will take and when it would be best to run the alert. If this alert takes a lot of processing time, you should run it when the business is closed. For example, we want to run this alert once a month, at midnight on the last day of the month.
-
With the Months button selected, do one of the following:
• To select an individual month, click the name of the month.
• To select all of the months, click your mouse on January and drag it to December. This selects all of the months.
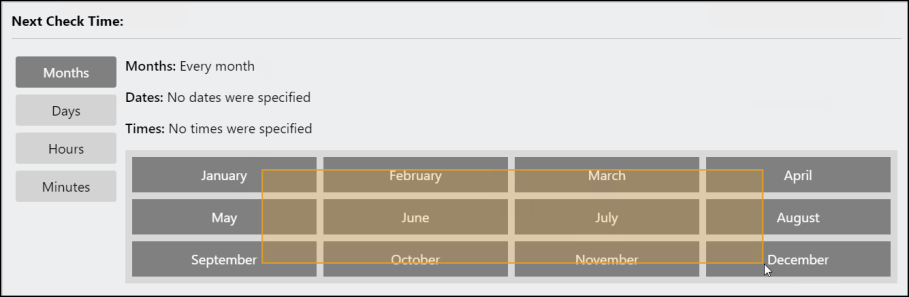
Configure a Chart Alert: Schedule Tab > Months Selection
b. Click the Days button to display the Days options.
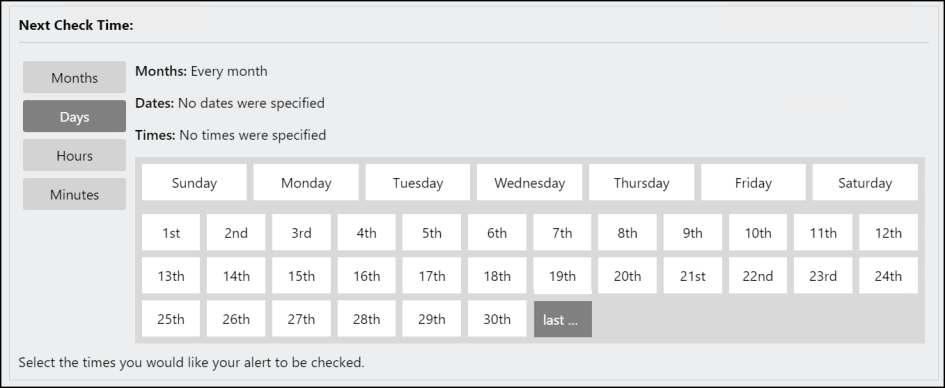
Here, you can click a day of the week, a day of the month, or a group of days using the same dragging motion with your mouse.
c. Click the Hours button to display the Hours options.
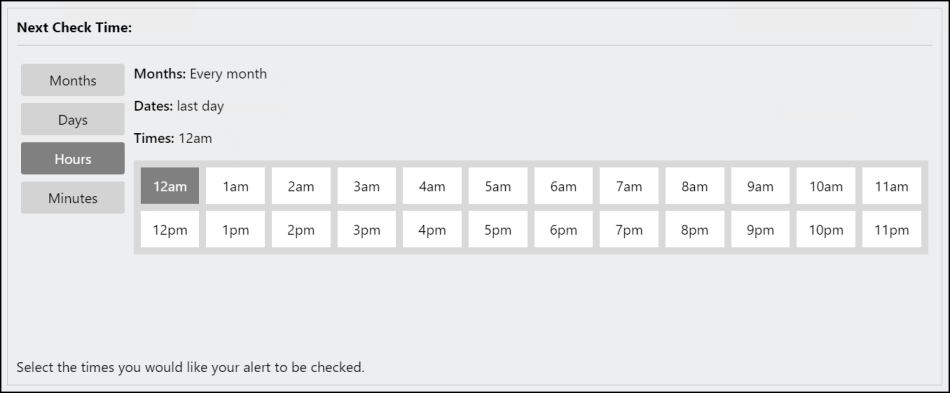
Configure a Chart Alert: Schedule Tab > Hours Selection
Click the time or use the dragging motion with your mouse to select the hour or hours you want the alert to run.
d. Click the Minutes button to display the Minutes options.
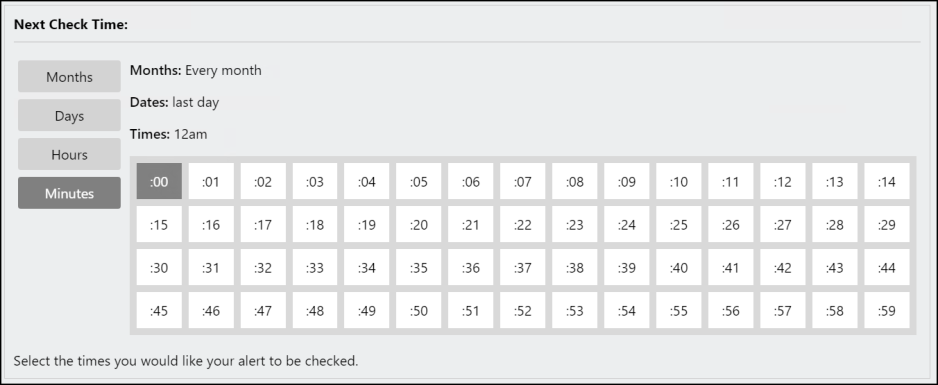
Configure a Chart Alert: Schedule Tab > Hours Selection
Click the Minute of the hour that you want the alert to run or use the dragging motion with your mouse to select the minutes you want this alert to run. It is best to select only one minute from this list. If you do not select a minute, the alert runs on the first minute of the hour you selected.
14. When the schedule settings are complete, you may want to click the Reactivation tab.
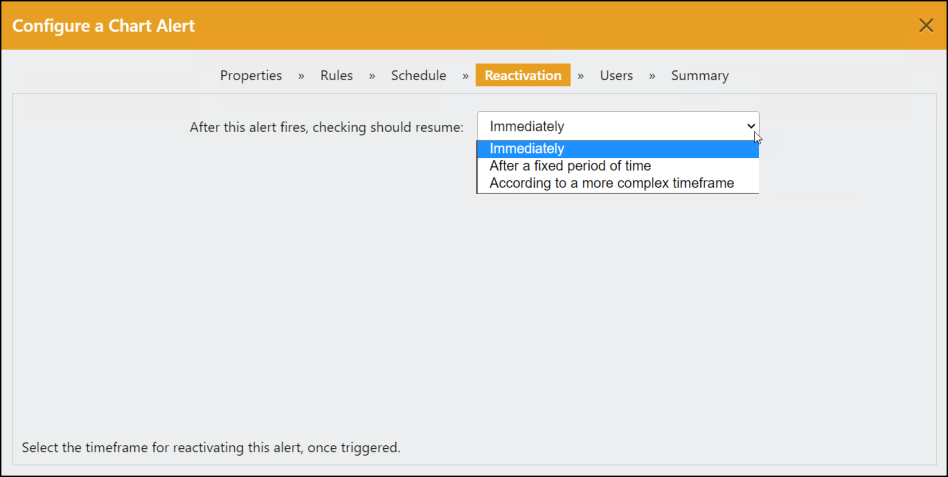
Configure a Chart Alert: Reactivation Tab > Options
Typically, you use this tab to run the alert immediately to test it or when you have disabled the alert for some reason. To reset the alert using a new schedule choose one of these options based on when you want to reactivate the alert. Choose one of these:
-
Immediately to run the alert now,
-
After a fixed period of time to set the number minutes, hours or days from now to run the alert.
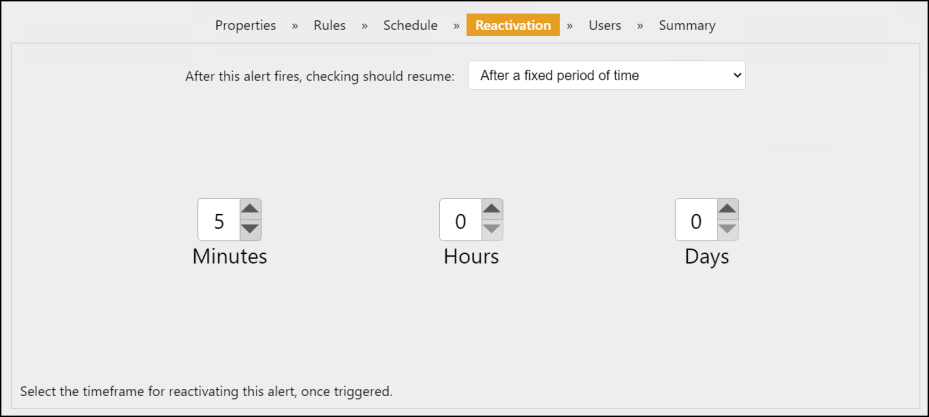
Configure a Chart Alert: Reactivation Tab > After a fixed period of time Options
-
According to a more complex timeframe, to use the same Months, Days, Hours, and Minutes settings described above to set the timing of the next alert.
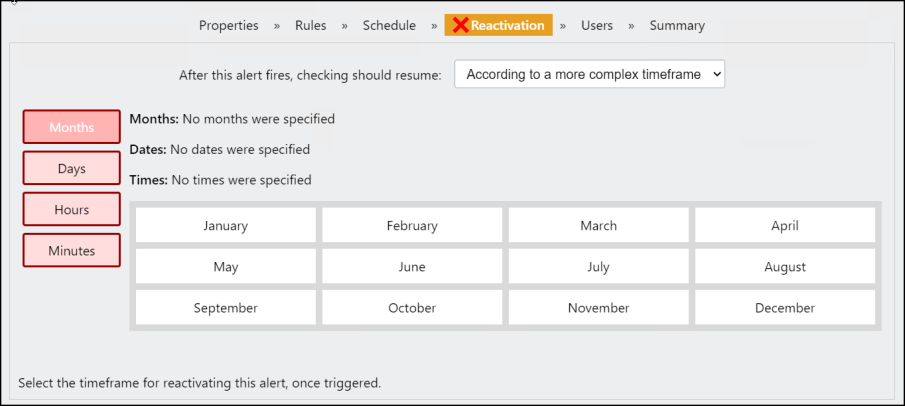
Configure a Chart Alert: Reactivation Tab > Complex Timeframe
15. When these settings are complete, click the Users tab.
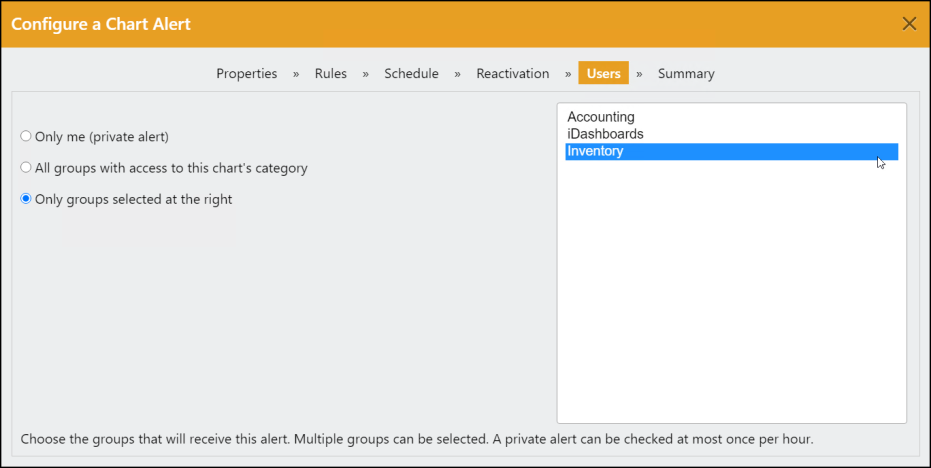
16. Choose one of the following to specify to whom the alert should be sent:
-
Only me (private alert)
Select this option to send this alert to the person creating the alert.
Note: When choose this option, the application does not allow you to run the alert more than once an hour. An error message displays until you reset the timing. -
All groups with access to this chart’s category
Select this option to send this alert to a particular group that has access to the chart on which the alert is based. -
Only groups selected at the right
Select this option and click the group or groups to which this alert should go.
17. When you have completed this selection, choose Summary.
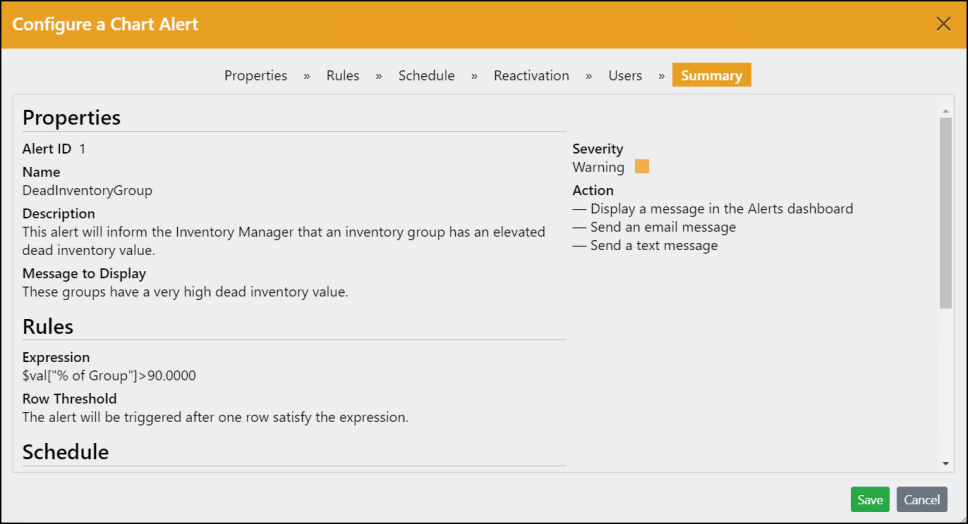
Configure a Chart Alert: Summary Tab
18. Review the alert options to ensure they are what you want. You can return to an earlier tab by clicking the tab and making change to the entries. When you make changes, the Summary tab updates right away.
19. When you are ready to save the alert, click Save.
A message displays to tell you that the alert has been successfully saved.
A green bullet displays beside the alert to indicate that it is active.
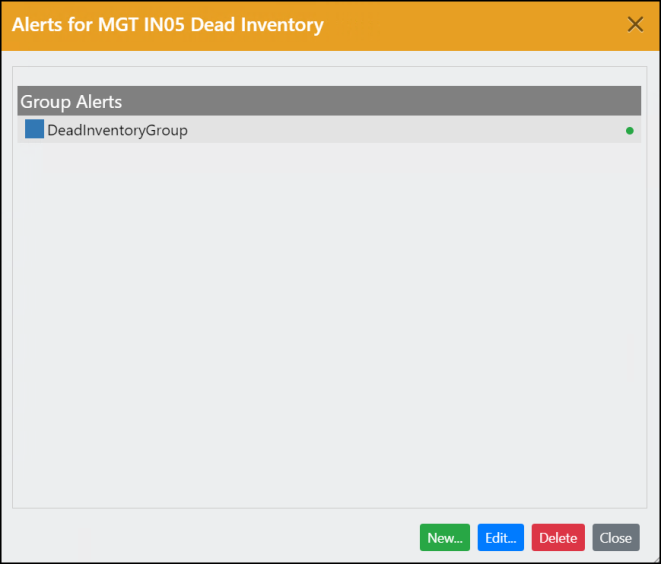
Alerts for the Selected Chart
You can edit this alert at any time by selecting the Edit button or delete it using the Delete button.
To view a list of scheduled alerts, from the Lobby, choose View > Hamburger menu  > Alerts.
Note: The color of the icon is based on the type of alert you created Critical is Red, Warning is Yellow, Informational is Blue, Excellent is Green.
Alert Settings
When the alert runs, iDashboard sends the results of the alert to the people/groups at the time you chose.
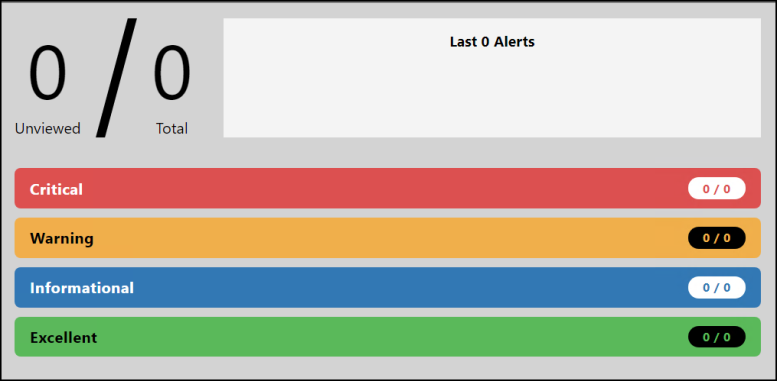
Viewing the Alert Details on the Dashboard
When the data reaches the threshold and triggers the alert, the Alert Dashboard displays the details.
To see the results of an alert:
1. From the Lobby, choose Admin > Alerts to display the Alerts Dashboard.
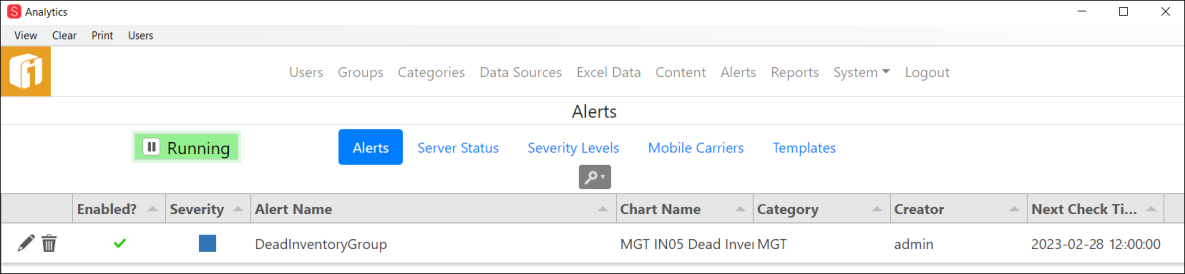
Alerts Dashboard
The structure of the email message is based on a template, which you can review by selecting Alerts > Templates > Alert Email > Edit.
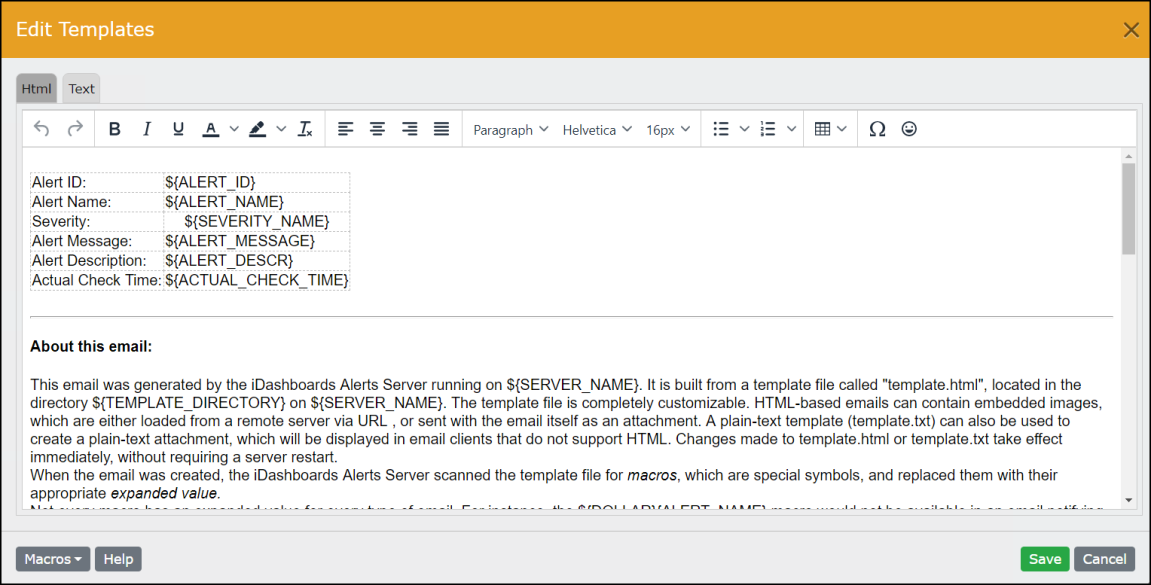
Alerts Dashboard > Alerts > Email Template
Text messages are limited to the “Message to Display” text you add when you create the alert.