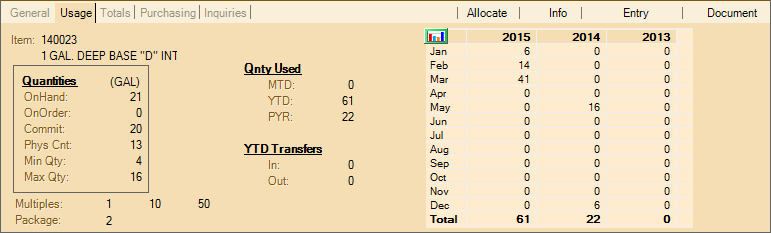
Usage
The Usage tab displays quantity information as well as up to 3 years of usage for the selected item. Usage is comprised of sales (returns reduce usage) and use of the item for manufacturing purposes. It does not include transfers from one location to another.
To view additional information about the quantities displayed, ![]() click here.
click here.
Vendor-Item Information
Below the quantities, vendor-item information (multiples and the vendor's package quantity) may be displayed for the selected item and the transaction's current vendor (if any). If the transaction has no vendor, no figures are generally displayed. On the general tab, the item's primary vendor multiples and package quantity are shown (not the vendor selected for the transaction). Up to three (3) multiple quantities will display as defined for the vendor-item (vendor items are defined from the Purchasing tab of Item Maintenance).
Quantity Used
This section of the folder tab lists summary totals of usage by period. MTD (month-to-date) is the sum of usage for the current month. YTD (year-to-date) is the sum for the current calendar year. PYR (prior year) is the sum of usage for the prior (previous) calendar year.
YTD Transfers
These figures are summary totals for transfers. A separate total is provided for the quantity transferred "in" (to this branch) for the current year and "out" (from this branch) for the current year. Usage does not include transfers.
Usage Grid
•A graph function is available by clicking on the graph icon ![]() on the usage grid.
on the usage grid.

Graphing Context Menu
There are two (2) options listed on the context menu: show bar chart and show data grid. The "data" grid is the default display. The data grid consists of three (3) columns of usage quantities for each of the three years each displaying twelve (12) rows for each month of the year plus one additional row for totals. The "bar" chart uses the quantities to create a graphical display for a month and year comparison (see below).
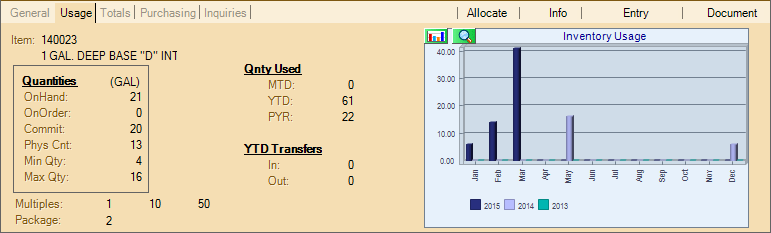
When a chart is displayed, another graphical icon appears ![]() . The magnifying glass icon expands the graph to a more readable size (see below).
. The magnifying glass icon expands the graph to a more readable size (see below).
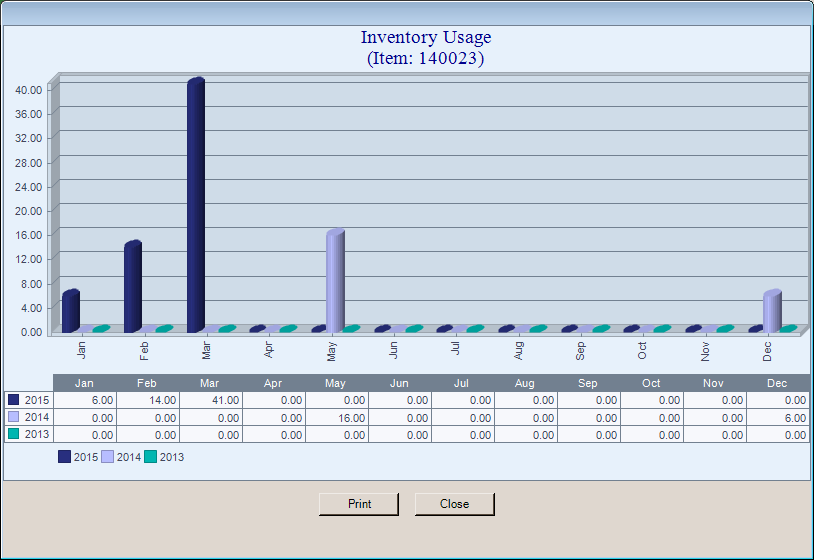
Hovering your cursor (mouse) over a particular year-month bar highlights the corresponding usage total in the grid below the chart. Additionally, hovering over a year highlights just that year in the chart making the other years' bars transparent.