Totals
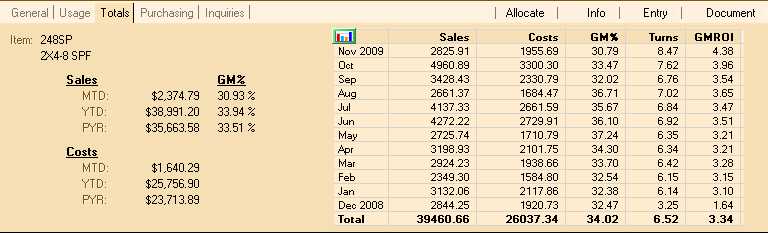
The Totals tab offers a grid displaying a rolling twelve (12) months of sales, cost of sales (COGS), gross profit, turns, and gross margin return on investment (GMROI) information. Sales and cost of sales for the current month-to-date, current year-to-date, and prior year (in total) are displayed to the left.
|
Note: the totals appearing at the bottom of the grid are for a "rolling" twelve (12) month period. The summary sales and cost totals for current (YTD) and prior year (PYR) displayed to the left of the data grid are calendar based. |
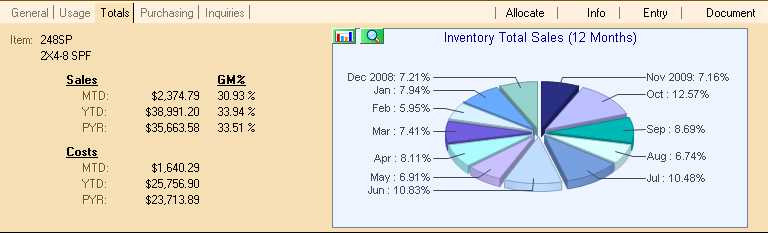
There are two (2) chart style display options available from the data grid: a 12 month sales pie chart (shown below) and twelve (12) month sales/cost bar chart. Use (click on) the ![]() icon to select a graphing option. The "inventory total sales" pie chart will display sales by month and the percentage that each month makes up of the last 12 months of sales.
icon to select a graphing option. The "inventory total sales" pie chart will display sales by month and the percentage that each month makes up of the last 12 months of sales.
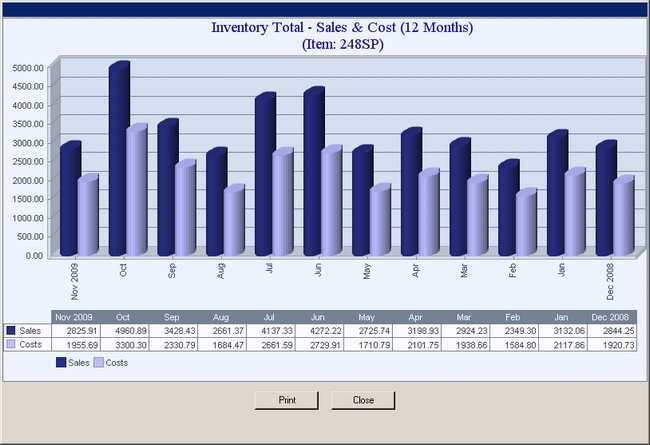
The "Inventory Total - Sales & Cost (12 Months)" chart lists the 12 months of sales compared with the cost of sales. Use the ![]() icon to expand the chart. Expanding a chart will display additional detail in some cases (see the grid at the bottom of the following example).
icon to expand the chart. Expanding a chart will display additional detail in some cases (see the grid at the bottom of the following example).
Graphs respond to the movement of your PC's mouse. When the cursor (mouse) is placed over an active area, such as a slice of pie, bar on the graph, or cell in the grid, you'll notice that the other bars and slices become semi-transparent so that focus is placed on the selected area. For example, in the graph displayed above, we can move the mouse's cursor to the cost of sales bar for September 2005 (see the example below):
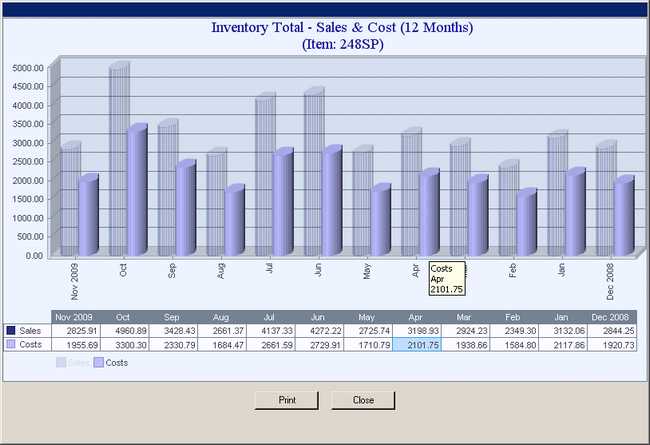
Focus is placed on the cost of sales bars and also the month of September in the grid displayed below. By hovering over the grid, the dollar amount is also reported next to the cursor. Click on a cell in the grid below the chart to place focus on an individual month instead.