Inventory Folders > Usage
The Usage tab displays up to three years of usage for the current item (the Active item in the grid). Usage is comprised of sales (returns reduce usage) as well as use of the item for manufacturing purposes. It does not include transfers from one location to another nor does it include adjustments. Some transactions don't affect usage such as Direct Sales. Quantity information is repeated on this tab for reference.
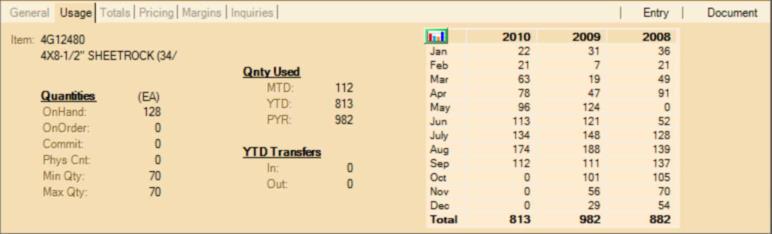
Quantities
The selected item's current stock status and purchase settings (minimum and maximum) are listed for reference:
•On-hand is the quantity of the product that should be in your company's possession but may not be the amount available for sale (available quantity reflects the quantity available for sale).
•On-order is the quantity that has been ordered from a vendor for stock replenishment (the quantity of the item on open and "ordered" purchase orders).
•Commit (committed) lists the quantity of the item on open customer orders (the quantity already reserved for customers who ordered the product).
•The Available is the quantity that is eligible for sale (it is the on-hand less the committed quantity).
• The Minimum is the re-order point for the product. It is the lowest quantity to be maintained in inventory before an item is re-ordered.
•The Maximum is the highest quantity that your company wants to maintain to be fully stocked. This would be used when determining the quantity to order from a vendor to replenish quantities you have sold or used.
Quantity Used
These totals list total quantities used for the current month (MTD), current year (YTD), and for the previous or prior year (PYR). The "PYR" total is for the entire year and is not a year-to-date figure.
YTD Transfers
If the item has been transferred either in or out of the current branch location, the total quantity transferred will display here.