Inventory Folders > Totals

The Totals tab offers a grid displaying a rolling 12 months of sales, cost of sales (COGS), gross profit, turns, and gross margin return on investment (GMROI) information for the current or selected item. Sales and cost of sales for the current month-to-date, current year-to-date, and prior year (in total) are displayed to the left. The totals appearing at the bottom of the grid columns are for a "rolling" 12-months whereas the summary totals for current and prior year are calendar based.
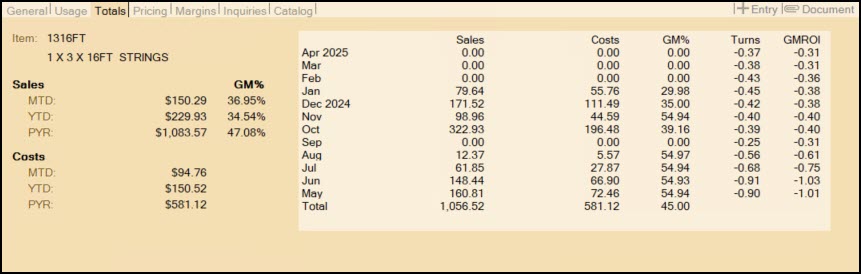
Sales

Summary sales figures are displayed for the current month (MTD), current year (YTD), and prior/previous year (PYR). The prior year figure is not a "to date" figure, it represents the entire prior year. Gross profit margin is displayed to the right of each figure. Gross margin percent is calculated by dividing the profit (sales - cost) by the sales figure (profit/sales) and multiplying the result by 100 (to represent a percentage).

Costs

Summary cost of sales (COGS) figures are displayed for the current month (MTD), current year (YTD), and prior/previous year (PYR). The prior year figure is not a "to date" figure, it represents the entire year.

Sales Table & Graph Options

The totals grid lists the past 12 months of sales activity for the item. For each month, the total sales, total cost of sales, gross profit margin, turns, and GMROI (Gross Margin Return on Inventory Investment) are displayed.

There are 2 graphic display options available on the Totals grid: a 12 month sales pie chart (shown below) and a 12 months sales/cost bar chart. Use (click on) the clip0551 icon to select a graphing option. The "inventory total sales" pie chart will display sales by month and the percentage that each month makes up of the last 12 months of sales.

The "Inventory Total - Sales & Cost (12 Months)" chart lists the 12 months of sales compared with the cost of sales. Use the clip0553 icon to expand the chart. Expanding a chart will display additional detail in some cases (see the grid at the bottom of the following example).

clip0557

Graphs respond to the movement of your PC's mouse. When the cursor (mouse) is placed over an active area, such as a slice of pie, bar on the graph, or cell in the grid, you'll notice that the other bars and slices become semi-transparent so that focus is placed on the selected area. For example, in the graph displayed above, we can move the mouse's cursor to the cost of sales bar for September (see the example below):

clip0558

Focus is placed on the cost of sales bars and also the month of September in the grid displayed below. By hovering over the grid, the dollar amount is also reported next to the cursor. Click on a cell in the grid below the chart to place focus on an individual month instead.