Sales Tax Report (United States)
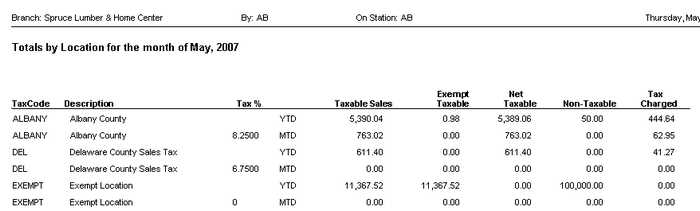
This topic refers to the Sales Tax report for the United States only. Reports and tax handling vary based on region. Sales tax reporting can be done for a specific date, selected month, or date range. Users can select from two versions available: summary and MTD/YTD. The difference between the 2 versions is that the MTD/YTD version reports a row for both the month and year-to-date selected. Only month-year selection is allowed when using the MTD/YTD version.
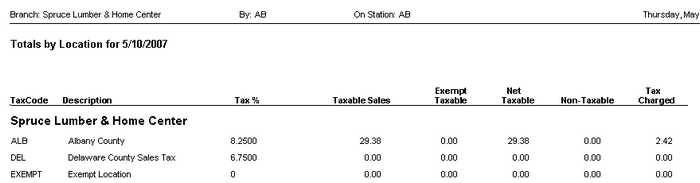
Summary Version
MTD/YTD Version
The report lists tax codes, description, tax percentage, taxable sales, exempt sales, net taxable, non-taxable, and tax charged for each location. Here are some definitions of the columns containing various sales and tax figures:
Taxable Sales
Taxable Sales is the total of the exempt taxable and net taxable sales for the tax location. It represents the total sales for goods that are normally taxable (disregarding the customer's tax status). This figure may include taxable store-use type inventory adjustments as "sales" since they also need to be reported. Store-use adjustments would not be reflected in branch or other sales totals and don't affect usage.
Exempt Taxable
Sales for taxable goods sold to an exempt customer are considered "exempt taxable" for the purposes of reporting. Tax is not charged on the sale, but would normally be charged except for the customer's status. A taxable location may show exempt sales if a sale is processed to a tax exempt customer but using a normally taxable location code. Some tax exempt customers are assigned to an exempt location as well, but this isn't necessarily true in all cases.
Net Taxable
This figure is the net sales amount that tax was charged on. Basically, it's the difference between taxable sales figure and any exempt taxable sales to the same location.
Non-Taxable
Non-tax sales are for goods that are not eligible for sales tax such as food, bottle deposits, American flags, clothing (in some areas), etc. This has to do with the tax status of the goods being sold rather than the customer's tax status. Non-taxable sales are not reflected in the other 3 sales-based columns listed (taxable sales, exempt taxable, and net taxable).
Tax Charged
Tax charged is the sum of the tax calculated at time of sale for the period reported. It is not necessarily tax that your company has received payment for and will include charge sales that may not have been paid by the customer. If your company pays sales tax based on when tax is paid, you will need a custom report for sales tax reporting.
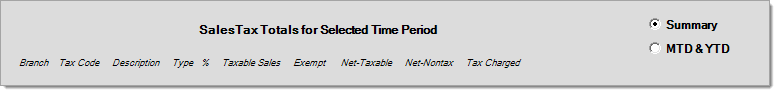
Report details include branch, tax code, description, type, tax rate (%), taxable sales, exempt taxable sales, net-taxable sales, non-taxable sales, and tax charged.
Reconciling Sales to the LedgerThere are a number or reports and inquiries available with the software that report "sales" information for a period of time. These include reports and inquiry for Totals, Sale Tax, and Sales Analysis. Financially, the Income Statement (aka. P&L) would report your company's income from sales and might be compared to "sales" totals from the previously mentioned reports and inquiries. Below, you will find a listing of some nuances about each type of report/inquiry that you should be aware of before making comparisons: TotalsBranch sales totals include inventory sales except for gift cards and stored value cards. Totals include adjustments. "Net" sales would be compared to the Income Statement or other reports since it includes cash sales, cash returns, charge sales, and charge returns less any sales tax. Sales Analysis (Inventory)This report is based on the sales totals as recorded for inventory items (these can be individually viewed by item also). The report includes items as based on your selection criteria, so if that selection criteria includes gift card or stored value card type items, these "inventory" totals would not match the branch totals. Inventory sales totals do not include adjustments which would be another difference between inventory sales and the branch totals (and possibly your Income Statement). Inventory sales do not include sales tax. Sales Tax ReportThe sales tax report and inquiry include any activity affecting your company's tax liability. If your company does inventory adjustments for "store use" that are taxable, these would appear on the Sales Tax report and inquiry as "sales," but not appear as sales on the (branch) Totals report or inquiry. Store use adjustments do not affect usage nor do they affect item sales totals, so they would not be reflected on the (inventory) Sales Analysis report. Income Statement (aka. Profit & Loss or P&L) This financial statement (report) compares your company's income to its expenses in order to determine the net income or profitability of your company. When income exceeds expenses, your company is profitable; otherwise, your company is operating at a loss. System journal mapping and detailed mapping determine how software activity affects your company's financial statements. The structure of your ledger (Chart of Accounts) determines the appearance of the financial statement (the levels of totals and detail as well as the order in which accounts and summaries are listed). If your chart of accounts is designed in a way that separates the income from inventory sales from other types of income, it's easier to make comparisons between those totals and other areas. Income accounts may be used for other types of income and affected by non-sales activity. Manual journals as well as income that originates outside of Point of Sale can make comparisons more difficult. Reason for DifferencesThe following listing provides possible explanations for differences you may find when comparing reports and inquires to your financial statement or ledger account activity. •Adjustment Code Mapping When adjustment codes are mapped to a ledger account that is not in the Income category, sales affected by the adjustment won't appear on the income statement, but are included in sales totals from other areas. •Inventory Sales Mapping It is possible to map sales for specific product groups to any ledger account, including accounts that aren't income accounts (or an income account that's not normally used for inventory sales). This type of mapping is commonly done when "items" are used for non-inventory purposes such as gift cards, labor, delivery, and deposit reasons. Separate mapping exists for cash sales, cash returns, charge sales, charge returns, exempt cash sales, exempt cash returns, exempt charge sales, and exempt charge returns. When mapping a specific product group (such as for gift card sales) differently, it's important that all the appropriate sales categories be mapped. When detailed mapping doesn't exist, the default accounts from the system journal mapping are used (which may place certain types of sales in the wrong account or category). For example, if you mapped cash and charge sales for gift cards to a liability account, but forgot to map exempt sales or returns (if allowed), you might wind up with some gift card sale/return transactions affecting income accounts and others affecting liability accounts. •Gift Cards Gift card sales are linked with a special item-type of either "gift card" or "stored value card." Sales of gift cards are typically backed out of branch sales totals so that sales are not affected twice (once when the card is sold and again when the card is used as a method of payment). If the gift card, or stored value card, is mapped to a regular inventory "sales" income account in the ledger, it will appear as income on financial statements, but not appear in most sales totals. Inventory totals are updated for gift card and stored value card items, so the (inventory) Sales Analysis report would include these sales if the gift card items aren't excluded by using selection options (such as product group/section) when running the report. •Non-Taxable Coupons Non-taxable coupons reduce the sales tax liability of a transaction, so that the expected sales tax amount may not be reflected in the Sales Tax Report. This can cause a mismatch between your Sales Tax Report and your Point of Sale totals. You may want to keep this in mind when you are running a non-taxable coupon promotion. •Other Types of Non-Sales Income It's important to understand and consider the source of income that appears on your financial statement(s). Income may originate from Payables discounts and Receivable Finance Charges (paid), for example. Another possible source of differences would be Miscellaneous Payments processed from Point of Sale, Payments. Consider whether your company uses any income accounts for returned check fees, charitable donations, or other non-sales reasons. These would not be included in either branch, sales tax, or inventory totals. Check your system and detailed mapping for any "income" accounts. This may help you find non-sales activity which needs to backed out of your comparison. In general terms, when making comparisons, it is more accurate to compare overall totals (your entire inventory sales to sales income, for example) to the current date rather than trying to tie-out specific products or groups or past time periods. It is possible for changes to data, such as inventory items, to alter how sales are reflected by reports run for prior periods (item merges, product group changes, ledger mapping modifications, etc.). |
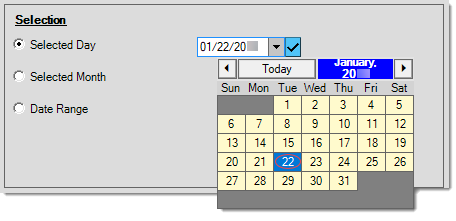
Selection
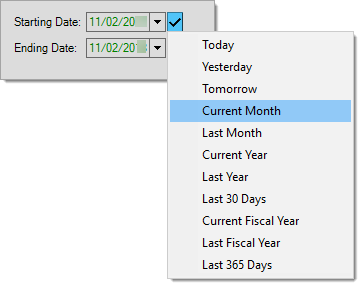
Users can choose from one of 3 date selection methods when running the summary version of the report: selected day, selected month, and date range. The MTD & YTD version only offers one selection choice: selected month. When applicable, use the radio buttons and date fields to designate a reporting period.
Some fields contain preset dates, particularly when the circumstances require a date range. When saving and scheduling reports, preset dates are the only date selections that automatically update when you save a report or process a scheduled report (manual date selections only run for the original date selected). The Check Mark icon ![]() indicates that preset values are available. Click the icon to review a menu of preset date selection options.
indicates that preset values are available. Click the icon to review a menu of preset date selection options.
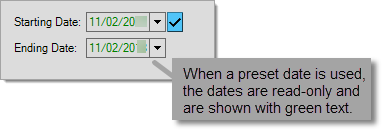
After you make a date selection, the date fields become read-only (disabled) and you cannot change them manually. The application displays the dates in green.
Preset values are based on the current date by default or use the current date to determine the "current" period (such as the current month or year). Fiscal year values may consider the current date as well but also use parameters for your financial (fiscal) year to determine the starting and ending months.
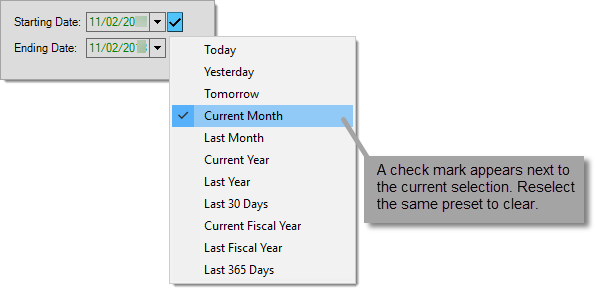
To clear a preset, reselect the same preset from the context menu. The date values may remain but the application will allow you to modify them after you clear the preset dates.
Choosing Branch-Specific Options for a Report
When a report offers branch selection options, the selected branch(es) have a check mark beside them. You can apply these selections in a number of ways.
For example, invoices can have several branches records associated with them, such as an entry branch, sales branch, and materials branch, which all can have different tax locations. Reports apply branch selections based on the type of data being measured, and for some businesses, branch selection may not apply.
Being able to select the Branch setting is also affected by the user permissions of the person generating the report. Only users who have permissions to review the data from multiple branches can select additional branches.
")
Branch Selection (Enabled) |
")
Branch Selection (Disabled) |
The Menu Marker  gives you a way to select the current branch, or select/clear all branch selections. You can also perform branch selection based on a pre-defined Branch List. (You can group branches into a Branch List, which you can use to create reports specific to related branches. Use the Maintenance > Database > Branch Lists option to create them). If you choose a Branch List, the data associated with the branches belonging to that list will be enabled and used to generate the report.

After you select a Branch List, the List name is listed (in parentheses) and the list of branches is disabled. To change the list selection, deselect the list from the Menu Marker  list.
list.
Additional Branch Selection Options
Some reports offer additional options along with branch selection. These either alter the report format based on how you want branch records presented (Consolidation) or allow selection when more than one branch may be indicated within the data being reported (Quantity vs. Sales branch, for example). For additional information about these "extra" options, click here.
Creating Summarized or Detailed Reports Using Branch Consolidation OptionsWhen a report has Consolidation options, you can choose how the report groups the branch results. Consolidation options are not listed or available for all reports. 
In some cases, "sort by" and totals options may provide similar types of results when the sort by selections include "branch." Grouping Branch Report Results by Branch Type (Entry, Quantity, or Sales)Some reports include data that may reference more than one "type" of branch. For example, orders and invoices can have up to three branch settings associated with them: Entry Branch, Quantity (Qty) Branch, and Sale Branch. 
|
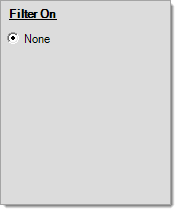
Selecting Filter Options for a Report
There are no filters available for this report.
Choosing Sort By Options for a Report
Some reports offer sorting options that may be used in addition to, or in place of, the report's default sorting. Sorting determines the order that information appears on the report, but also can determine how subtotals (when enabled) are done. Typically, the application provides subtotals for any sort by selections when subtotals are indicated in the "Totals" panel. If sorting is not available for a report, the panel is disabled.
")
Sort By (Enabled) |
")
Sort By (Disabled) |
Some reports have two or more sorting options available; however, both are not always provided. When both are enabled for a report, the top selection is considered the Primary sort setting and the bottom is considered the Secondary sort. Usually, all sort selections are optional. Sort options vary by report.
Sort Direction
Choose the Menu Marker ![]() beside the List button, to select the direction of the sort order, either Ascending (the default) or Descending. Almost always, data is sorted alpha-numerically. This may even be done in some cases when the data being sorted appears to be numeric in value. Date values and some truly numeric values are sorted based on value rather than alpha-numerically in certain cases. When alpha-numeric data is sorted in Ascending order, it is sorted from the left-most character to the right-most character based on the ASCII value. The length in characters typically has no effect on sorting in these cases. Most (not all) symbols and special characters are listed before numerals, numerals typically appear before letters, and upper-case letters are listed before lower-case. When sorted (alpha-numerically) in descending order, this ordering is reversed. Sometimes, particularly in the case of items, a "report" or "sorting" key is used in place of item numbers. This allows a company to control sorting while not having to alter their item SKUs. The sorting (report) key isn't always shown (listed) on the report or in other areas where it affects sorting.
beside the List button, to select the direction of the sort order, either Ascending (the default) or Descending. Almost always, data is sorted alpha-numerically. This may even be done in some cases when the data being sorted appears to be numeric in value. Date values and some truly numeric values are sorted based on value rather than alpha-numerically in certain cases. When alpha-numeric data is sorted in Ascending order, it is sorted from the left-most character to the right-most character based on the ASCII value. The length in characters typically has no effect on sorting in these cases. Most (not all) symbols and special characters are listed before numerals, numerals typically appear before letters, and upper-case letters are listed before lower-case. When sorted (alpha-numerically) in descending order, this ordering is reversed. Sometimes, particularly in the case of items, a "report" or "sorting" key is used in place of item numbers. This allows a company to control sorting while not having to alter their item SKUs. The sorting (report) key isn't always shown (listed) on the report or in other areas where it affects sorting.

Below is a table listing item numbers in ascending vs. descending order. In most cases, items are sorted using their report sequence, not the item number. Report sequence allows grouping of items in a logical order vs. the alpha-numeric order of the SKU and are commonly used when item numbers represent dimensions or other attributes.
For example, you might have two item SKUs of "248" and "2410." The "248" represents an 8 foot (8') length and the "2410" a ten foot (10') length. If these two items were sorted by item SKU, the longer length would appear before the shorter length due to alpha-numeric sorting; however, if you assigned a "report key" to the items of "020408" and "020410" respectively, they would instead be sorted by length. Note the use of leading zeros for each dimension (height, width, and length in this case).
| Ascending | Descending |
|---|---|
|
020408SYP |
ZITEM |
|
248 |
BRICK |
|
808957 |
808957 |
|
BRICK |
248 |
|
ZITEM |
020408SYP |
Choosing Totals Options for a Report
For some reports you can specify how Totals and Subtotals are organized. Using the Totals panel, you can select the types of totals you want the report to calculate (when applicable).
Grand Totals refer to an overall total appearing at the end of the report.
Subtotals are based upon the selections in the "Sort By" panel, so you cannot use this selection type when there are no "Sort By" options for the report; however, this can depend on the report.
The Totals panel is disabled (appears grayed out) whenever totals are not an option or when the use of totals require additional selections prior to use (such as a "sort by" selection). Totals do not apply to all reports; furthermore, some reports provide totals regardless of selections and do not allow overrides using the Totals panel.
")
Totals (Enabled) |
")
Totals (Disabled) |
You can select one of three Total panel options: Subtotals, Grand Total, or None. The Print Totals Only check box is available with the first two options only.
Subtotals
Subtotals indicate that the report should include totals based on the change of certain data. Typically, this "break" for totals is determined by your selections in the "Sort By" panel. Some reports may automatically provide a subtotal level. When the "subtotals" selection is chosen, the report will also include a grand total.
Grand Total
Grand total indicates that the report should include a grand total (ending total) printed on the last page below the last details (when "print totals only" is not checked). Subtotals would not be included when this option is selected.
None
This selection indicates that no totals are to be included when the report is viewed, printed, or processed as a file. If you choose "none," the "print totals only" check box is disabled and the check (if any) is cleared.
Print Totals Only
Use this check box to suppress all the report details when the report is viewed, printed, or processed as a file. When you select this check box, the report only reflects the Subtotals and Grand Totals results.
Setting the Output Options for the Report
Most reports share the same common print control. This allows the report to be either printed or saved as a file. When printing, a user can select either 1 or 2 printers and can also set the number of copies for each. When saving as a file, you can select from a number of different types (PDF, Microsoft Excel®, HTML, and TIFF). Neither printing nor saving as a file are required. These would only be done if you wanted to save a copy of the report and data for a given point in time. Certain types of activity and changes can affect data, including what is commonly viewed as "history," so anytime a "snapshot" at a particular point in time is desired, having a saved or printed copy is suggested. Reports are often also used for inquiry purposes. In many of these cases, viewing a report is sufficient. Printing and saving are optional unless you have a reason to do them.
The Process (F12) function is used to either print the report or generate a report file. We suggest using the Preview (F8) function prior to printing or saving to ensure that the report results match what you want to print or save. You can also use the Viewer to print a report and allows you to choose to print only selected pages from a report.

Reporting: Print Options
1st Printer and # Copies
The drop down control next to the label "1st Printer" provides a listing of available printers. An available printer is a printer that is either installed on your local machine or a server accessible printer if you are connected via Remote Desktop services (aka. Terminal Services). The default selection is the backroom printer assigned to the current station (if any). The listing of printers may contain devices that are specialty types, such as label printers, etc. that are not suitable for printing reports. This printer is only used if the "Print Report" check box is checked and the number of copies is greater than zero (> 0). The application does not print the report until you choose Process (F12).
2nd Printer and # Copies
The drop down control next to the label "2nd Printer" also provides a listing of available printers (see above). This allows you to print a report at two separate locations if desired. Even if a selection is made, the second printer is only used if the "Print Report" check box is checked and the number of copies is greater than zero (> 0). The application does not print the report until you choose Process (F12).
Print Report
Select this check box to print the selected report when you click Process (F12). This box is checked by default (true).
Save In
This is a text area with a Browse  button that allows you to select a location where a report is to be saved as a file. Choose the Browse button to select an accessible file location. This might be on a local machine or a shared network location of some sort.
The application does not save your report as a file until you choose the Process (F12) function and only if you select the Output to File check box. Directory and file permissions can prevent you from saving files in some locations. It's best to choose a location you'll remember such as your "Documents" or "Desktop" locations.
Filename
This area allows you to set the file name you want to save the file with. The extension will automatically be set based on your selection from the "Type" drop down control. Saving (as a file) is not done until the user chooses Process (F12) and is only done if the "Output to File" is checked.
Output to File
This check box determines whether the report will be saved as a file when the user chooses Process (F12). The default selection is not checked (false).
Type
This determines the output format of the report when saved as a file. Choices currently include: PDF (Portable Document Format, .PDF), Microsoft Excel (Spreadsheet, .XLS), Hypertext Markup Language (Web Page, .HTM), or Tagged Image File Format (Fax, .TIF). The 97-2003 version of Microsoft Excel is used since it is forward compatible with newer versions. Free Adobe Acrobat Reader® software is required to access PDF format files. Any browser can be used to open HTML (HTM) files. TIF files is an older image format commonly used with faxing.
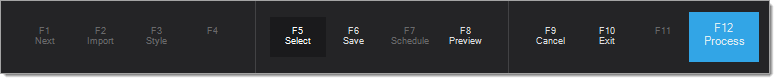
Using the Function Keys
A number of function keys are available with reports.
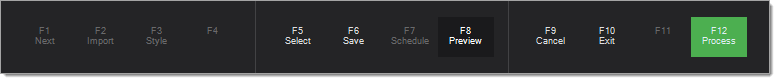
Preview (F8)
Use this function key to preview the report before printing or saving it to a file.
Process (F12)
Use this function key to choose options for printing, saving the report to a file, or transmit it, based on the report settings. These options are available with all reports. Others, such as those related to saving and scheduling, are available with many but not all reports.
Select (F5)
Use the Select (F5) function to choose and load previously saved report settings. You can save report settings using the Save (F6) function, when applicable (report saving and selection is not provided for all reports).
The "Select Report Settings" dialog box offers a drop down control for report selection. Only public and the user's own private saved reports will be included in the listing. After selection, the report's associated description is displayed below. Click or choose "Accept" to continue and load the selected settings.
")
Select Report Settings
Deleting Saved Reports
To delete a saved report, choose the Menu Marker ![]() to display a context menu and choose the Delete option to delete the previously saved report settings. The Menu Marker only appears after report selection and if you have permission to delete the report. You can only delete a private report that you created or a public report. User security can restrict the ability to view or access Menu Marker functions. In addition, deletion may be restricted if the report settings are currently used with report scheduling.
to display a context menu and choose the Delete option to delete the previously saved report settings. The Menu Marker only appears after report selection and if you have permission to delete the report. You can only delete a private report that you created or a public report. User security can restrict the ability to view or access Menu Marker functions. In addition, deletion may be restricted if the report settings are currently used with report scheduling.
Save (F6)
Use this key to save the current report settings (selection, filter on, totals, branch, etc.) for future use or scheduling. You cannot use this feature for all reports. Additionally, you may have to make a change in the report form before this function becomes available (since there is usually no need to save the default or initial settings).

To save a standard report for this report type:
1. Choose the new default settings using the criteria you need for this report.
2. Choose Preview (F8) and look through the report to make sure it displays the way you want it to and contains the data you need.
3. Choose Save (F6) to save your settings for future use or scheduling. The application displays the Save Report Settings box.
")
4. In the Report Name field, consider an appropriate name and description for the report and enter the following:
-
Report Name
This defaults to the name of the current report, but you can type over this entry to change it. The application will use this name as the default selection in the future.
-
Description The description also defaults to the current report's name, but you can change it as well. This might be used for longer or more descriptive information about the report.
-
Choose the Save as options based on the needs of the report settings you are adding. The Private and Public options determine whether the application displays your report settings to others in your company.
Choose:-
Private : Private report settings are only visible to the person who created them.
-
Public : Public report settings are visible to anyone with permission to use the current report.
-
5. When you complete these settings, click Accept. This saves the report settings. Typically, when you save a Public report, the application saves it to the Shared drive. When you save a Private report, the application stores it on your own drive.
Deleting a Saved Report Format
You can delete a report that you created from the Report Settings list.
1. Click the Select (F5) button to display the Select Report Settings box.
2. Choose the report you want to delete from the Report Name list.
3. Click the Menu Marker ![]() and choose Delete Report section for more details.
and choose Delete Report section for more details.
There is no confirmation message displays, so be sure you want to do this before you start.
Schedule (F7)
Use the Schedule (F7) function to process a saved report (with previously saved "settings") as a file based upon a defined schedule (Once, Daily, Weekly, etc.). Reports must be saved prior to scheduling so that settings for selection, totals, sort by, etc. are defined in advance. Scheduled reports are processed by application services and are saved as files on the server, not on your local machine. A built in delay between reports of two minutes (120 seconds) is used by services for processing scheduled reports. So if multiple reports are scheduled for the exact same time of day, it would be normal for there to be a difference in process times. Files with the same name and save location (directory) will be overwritten (you may want to use the Add Timestamp to Filename option to prevent this). The default directories (on the server) for scheduled reports and scheduled user reports are determined by parameters.
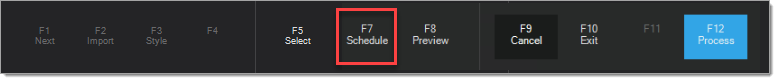
Note: this function will only be available (enabled) AFTER and IF a report has been saved and the saved settings have been selected. Some reports do not support saving and scheduling.
")
Frequency
You can schedule a report to run once or on a more regular basis. Options include the following: Once, Daily, Weekly, Monthly, and Yearly. The daily and weekly options change the file names used to prevent overwriting report files (continue reading for more information). For additional details regard frequency selections, click here
|
The following is a list of the different date based options for scheduling reports with examples of each form: OnceReports that are scheduled once, only generate one time for the date and time specified. ")
Schedule Task (Once) DailyReports scheduled for daily processing, involve specifying a time as well as a starting date for the recurring schedule to begin on. In addition, there are three choices for daily report processing: Every Day, Week Days, and Week Days plus Saturday. The day of the week is appended to the file name of the report to indicate the weekday (0=Sunday, 6=Saturday). For reports with date selections, only dates that involved a "preset" date selection will automatically refresh (update) the date selected; otherwise, the dates are assumed to be literal and are not updated based on the current date. For example, if you wanted to run a report daily and use the data on the date that the report runs, you'd need to choose a date preset of "Today" when saving the report settings used for scheduling. Instead, if you chose a specific date (not using the presets), the report would always run for that date instead. ")
Schedule Task (Daily) WeeklyWeekly reports can be scheduled to run on a particular weekday and time. In addition, the report may be set to run every week or using an increment of weeks (every 2 weeks or 3 weeks, for example). The base date (first occurrence) determines when the weekly schedule starts from. ")
Schedule Task (Weekly) MonthlyMonthly reports can be scheduled in one of two ways. One option is to schedule the report to run the same day each month (the 10th, for example). Instead of a specific date each month, users can choose a particular weekday occurrence such as the first Monday or third Thursday, for example. Because months don't all contain the same number of days, a "Select Month" function is available that allows users to schedule a report for specific months. One possible use for this would be in cases where you wanted to schedule a report to always run the last day of the month. In this case, you could create three different schedules. One for months with 31 days, another for months with 30 days, and a final one for February scheduling the report to run for the 28th (or 29th if a leap year).
YearlyThe yearly option involves just a date and time selection. Users specify the start date and time and if scheduled, the report will run at the designated time and date. ")
Schedule Task (Yearly) |
")
")
Start Time
Choose the time of day (Eastern Standard Time) that the scheduler should process this report.
First Occurrence
Choose the current or future date that the scheduled report should begin on. This might be a one time occurrence or it may repeat based on your "timing" selections in this form.
Save Filename
Use this field to enter the file name of the report. In certain cases, such as Daily processing, the file name is used to indicate a day of the week.
Working with Daily and Weekly Files and Naming Conventions
If you schedule a report for Daily or Weekly processing and save it in a PDF format, the application adjusts the file name of the report automatically to reflect the day the file is created for.
For example, if a daily report's file name is normally saved as mydailyreport.pdf, and it runs on a Monday, the file name is saved as: mydailyreport(1).pdf. This prevents the file from being overwritten, which would occur if the same file name is used daily. Weekdays are assigned numbers representing the day of the week, with Sunday serving as day zero (0) and Saturday as day 6 (six).
myreport[0].PDF (Sunday's Report)
myreport[1].PDF (Monday's Report)
myreport[2].PDF (Tuesday's Report)
myreport[3].PDF (Wednesday's Report)
myreport[4].PDF (Thursday's Report)
myreport[5].PDF (Friday's Report)
myreport[6].PDF (Saturday's Report)
Copy Pathname
Use the Copy Pathname field to choose an additional, secondary folder in which to save an additional copy of the same report. The file path for this additional copy is relative to the Scheduled Report directory, which is defined in Maintenance > Database > Parameters, on the Setup > System tab. The same file name logic as described above is applied to the file in the new folder you choose.
Type
Use this option to choose the output format of the report when it is saved as a file. Choices currently include:
-
PDF (Portable Document Format, .PDF),
Note: Free Adobe Acrobat Reader® software is required to displayPDF format files. -
Microsoft Excel (Spreadsheet, .XLS format),
-
Hypertext Markup Language (Web Page, .HTM),
Note: You can use any browser to open HTML (HTM) files. -
Tagged Image File Format (for Fax, .TIF).
Note: TIF files is an older image format commonly used with faxing. -
Microsoft Excel (Spreadsheet, .XLSX format)
Note: The 97-2003 version of Microsoft Excel is used since it is forward compatible with newer versions.
Add Time-Stamp to File Name
Choose this check box to include the time stamp for this report in the file name. This ensures that the report file name is unique and prevents it from being overwritten by a future schedule run (such as in cases where you want to save a monthly copy but not overwrite each month).
Save for User
If a user is selected, the report will be saved in the Users report directory within a folder matching the user's name.
Notify User
If checked, you will be notified each time the scheduler processes this report.
How are reports saved and where do I find them?
The path names entered determine the primary, and optional copy, save location(s) of the file on the server within either (1) the report or (2) user report directories specified in Parameters.
User reports are created under a folder matching the user's name in the designated "User Reports" directory. For example, if your user name is BOBG and you schedule a report using the "Save for User" option and the "user report" directory in parameters is "C:\SavedReports\Users\," the following path would be used for BOBG's reports:
C:\SavedReports\Users\BOBG\
This directory could then be shared with the user's Client machine either as a shared network location or drive. It is not possible to specify a drive or network location as the path name. Doing so will simply create a directory on the server matching the name you entered.
The client must have any necessary software installed in order to open the file format you specify. For example, a PDF (Portable Document File) file requires Adobe Acrobat Reader software and an Excel (XLS or XLSX) spreadsheet requires Microsoft Office Excel or other software capable of opening the file.
Preview (F8)
The Preview (F8) function can be used to display a report in the Viewer form. Viewing a report is strongly suggested before choosing to either print or process a report as a file since this can be used to both see the printed length in pages and also to check the report format based on the options you have selected. In addition, reports can be printed directly from the viewer itself which also allows for the added benefit of printing only selected page or pages and well as additional options your printer may offer.
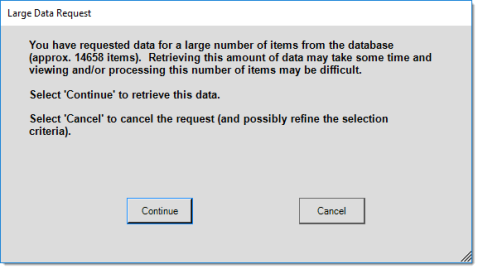
Each time preview is selected, the report will be generated which requires a retrieval of data. In some cases, and based on the criteria selected, you may be warned about the quantity of data being retrieved. Often, receiving a message such as this indicates that your report's selection criteria are too broad.
When should I save or print a copy of a report?
Despite the fact that most reports can be run at any time and usually for any period, the data used for reporting is rarely static. Anytime you want or need to retain a "snap shot" at a particular point in time, the only reliable way to do so is by saving the report as a file (PDF, etc.) or printing a hard copy for your records. Later changes such as merging, renaming or renumbering, deletions, and other changes can all affect whether data appears on reports or where it appears in some cases. For example, if you ran a sales analysis for inventory group 11 at the end of the year, and then modified one item in that group to now belong to 62, future reports would no longer show the same total for group 11 or 62. For the most part, changes such as those described here only affect data when viewed in parts rather than as a whole. Using our previous example, viewing total entire sales for all inventory wouldn't be affected by a change to one item's group at a later time.
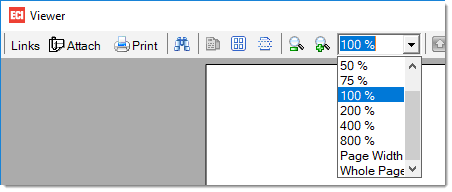
Using the Viewer
The same viewer is used for both reports and documents. The primary different between viewing a document and a report is that reports don't have document links. Some reports offer dynamic links to documents (within the report) which indirectly provide access to links for those documents. The same viewer window is shared by reports and documents. When more than one report and/or document is viewed (without closing the viewer in between), the prior reports (or documents) can still be viewed by toggling the current document using the "PrevDoc" and "NextDoc" buttons. This is not true when viewing more than one version of the same report or document, however. Although you can change the page size and quantity of pages visible in the viewer (side by side or tiled, for example), you cannot view different documents (or reports) at the same time or side-by-side. The only way to do this would be to open a second viewer from another application session or to save one or more reports/documents prior to viewing and open them as PDF (Portable Document Format) or some other type of file.

Viewer with EOD Cashier Report
For additional information about tools available in the viewer, please click here.
Document Viewer ToolbarThe following table lists icons and options used on the Document Viewer toolbar and explains what they do:
|


Cancel (F9)
The Cancel (F9) function reloads the current form, clearing any changes.
Process (F12)
The Process (F12) function prints and/or saves the report as a file based on your selections in the Print Options panel.