RockSolid MAX Daily Dashboard powered by Cognytics
The Daily Dashboard by Cognytics contains a series of dashboard widgets (charts) that show your current sales and inventory information based on the data your team enters into RockSolid MAX every day. ECI updates these dashboards nightly, using the new figures added during the day, making it easier for you and the decision-makers in your store to see the big picture of your sales and inventory. This hosted feature provides a secure platform to review the daily sales, costs, and inventory information in a daily, monthly, and yearly context. This dashboard contains the most frequently used reports to give you a quick but thorough assessment of your store’s financial status and current trends.
The Implementation or Support team can set up the infrastructure for this dashboard for you. You decide which users on your team have access to these reports, using the instructions in Setting up Access to the Daily Dashboard for Store Decision Makers.
To access the Daily Dashboard powered by Cognytics, from any application area, click the Analytics option.
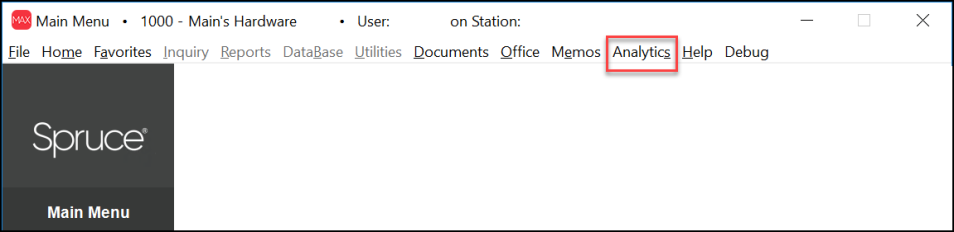
Main Menu > Analytics
The application retrieves the most current sales and inventory information from the nightly upload and displays it in easy to read, easy to manage visual diagrams and tables. When you launch the Cognytics dashboard, it displays full screen. You can resize the display based on the technology you are using to view the data (tablet or your laptop). If you have multiple branches, the data in these tables and diagrams reflect all the data combined in one place.
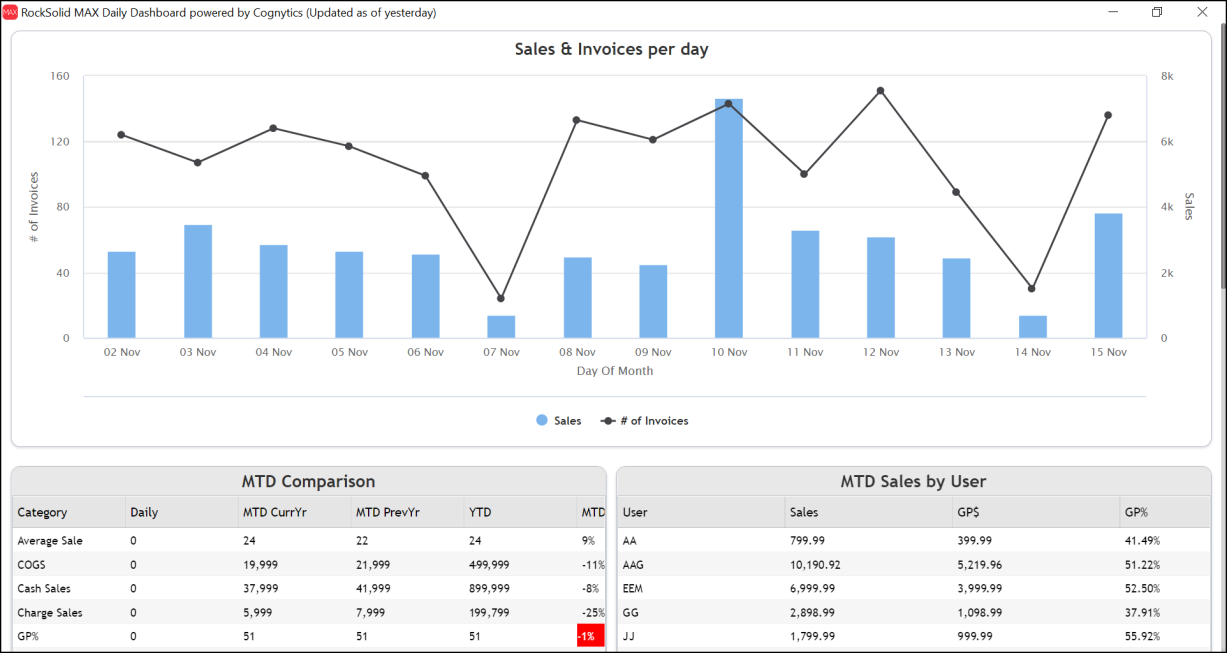
RockSolid MAX Daily Dashboard powered by Cognytics (Top)
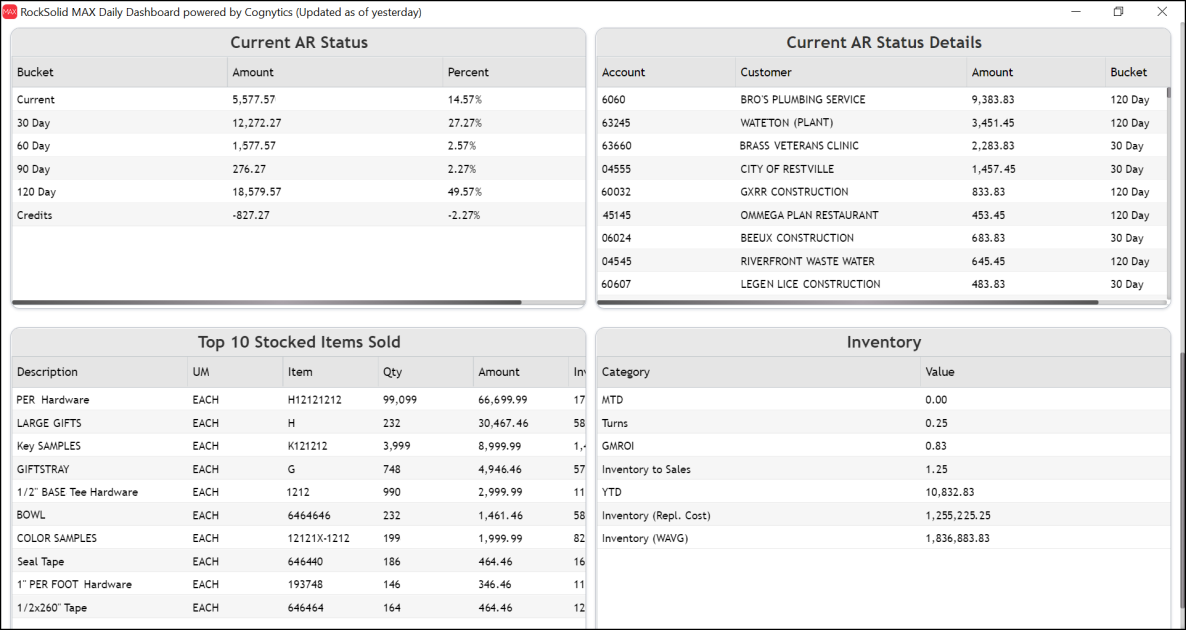
RockSolid MAX Daily Dashboard powered by Cognytics (Bottom)
What Information Does the Daily Dashboard Show Me?
There are seven dashboards that reflect your sales and inventory data for all branches, based on the overnight update:
Sales and Invoices per Day
This Sales and Invoices per Day diagram shows the amount the store took in in sales and the number of invoices for the last 14 active days. Days the store is closed are omitted from the report. The number of invoices scale is listed on the left side of the table and the sales amounts are listed on the right.
This diagram is useful for judging sales trends and average invoice size by day of the week. This diagram can also show the effectiveness of promotions in near real time and help plan staffing requirements for the future.
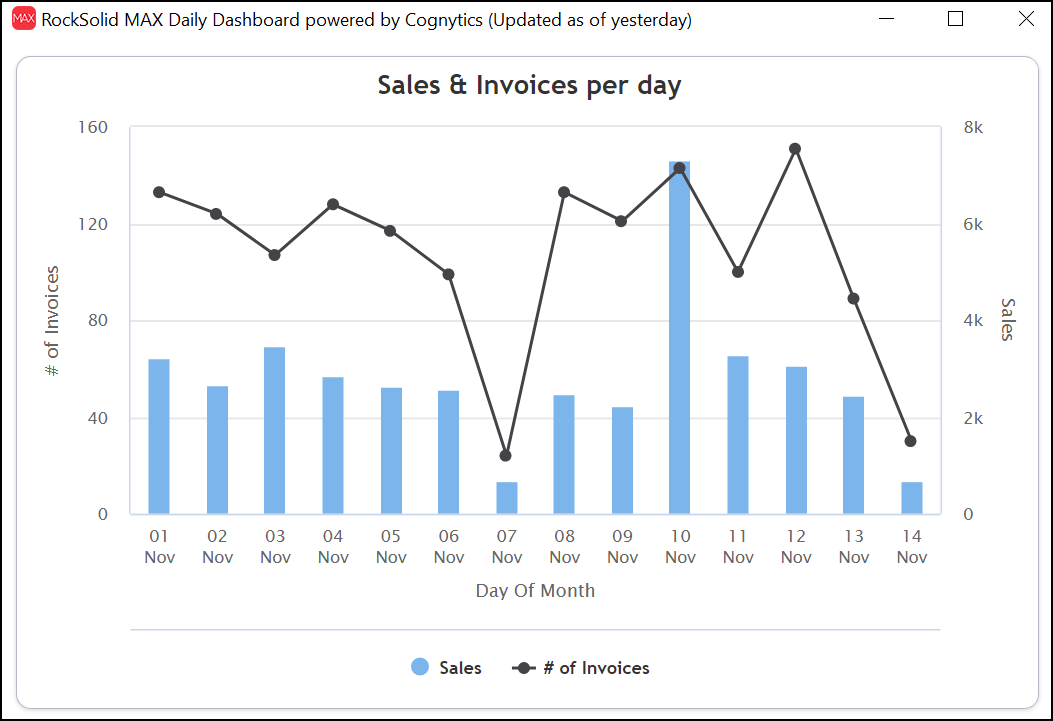
Sales and Invoices per Day
-
To see the total sales for a particular day, place your cursor on the Sales bar for the day you are interested in to display the amount.
-
To see the number of invoices created on a particular day, click the corresponding node on the Number of Invoices line.
Month To Date Comparison
The Month to Date (MTD) Comparison table shows the major business categories for the current month compared to the same month in the previous year, the total amounts for each category year to date, and the month to date variance between the current year and the previous year. This table provides a good overview of the current health of the store and shows trends in that business assessment.
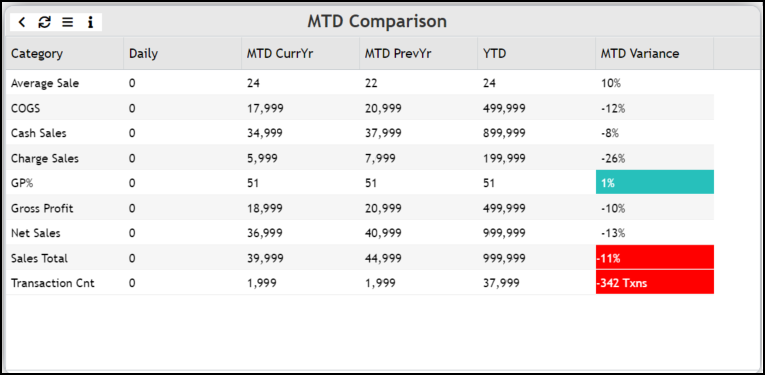
Month To Date Comparison
Business categories include:
-
Average Sale
-
Cost of Goods Sold (COGS)
-
Cash Sales (Cash Sales – Credits)
-
Charge Sales (Chare Sales – Credits)
-
Gross Profit (Percentage)
-
Gross Profit (Amount)
-
Net Sales
-
Sales Total (does not include tax)
-
Transaction Count
MTD Sales by User
This table shows the month to date sales by salesperson, including the amount sold, the Gross Profit amount for the good sold, and Gross Profit percentage for the goods sold. This report can provide a high level overview of an individual salesperson’s performance.
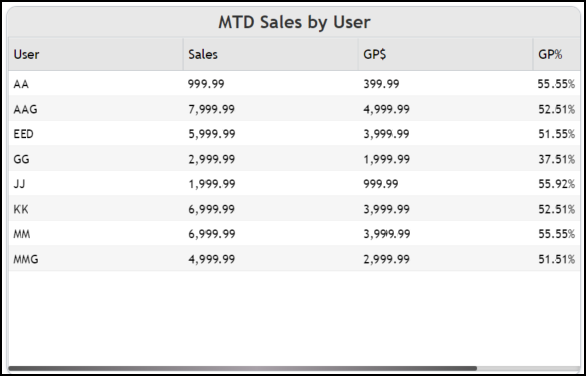
Month to Date Sales by User
Current Accounts Receivable (AR) Status and Current AR Status Details
These two tables show the current accounts receivable amounts and the percentages for a variety of increments and the credits associated with those receivables. The Details table shows the account numbers, account names, the AR amounts, and the receivable buckets for each receivable amount.
These tables can provide a snapshot of the health of outstanding AR balances. Current, in this context, refers to any receivables since the closure of the last billing cycle.
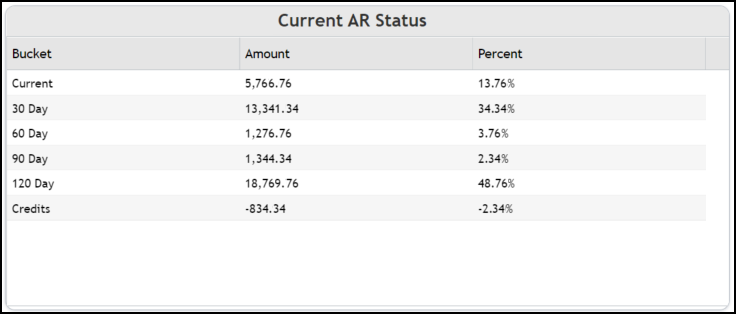
Current Accounts Receivable Status
When you select a bucket in the Current AR Status list, the Current AR Status Details list updates to reflect the corresponding Customers. If no buckets are selected, the Current AR Status Details list displays the accounts with the highest outstanding AR Bucket amounts.
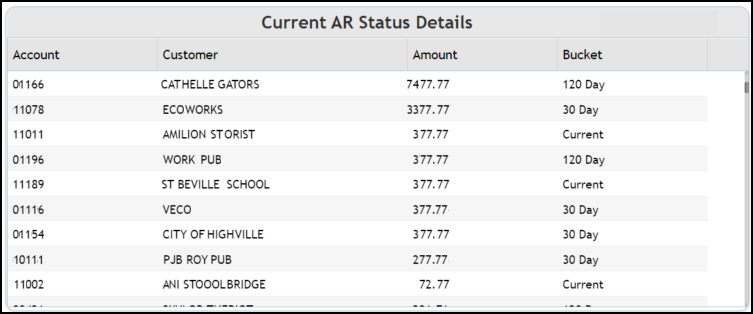
Current Accounts Receivable Status Details
Top 10 Stocked Items Sold
This table lists the ten items in your stocked inventory that have sold the most (by amount). This list displays by item ID, quantity, sale amount, and the number of invoices. Scroll to the right to see the entire list.
This list allows you to analyze what is selling based on the highest-dollar-amount sales (not profit) and
-
Shows the top 10 items sold in terms of value (i.e. dollar value, in the USA) over the past 14 days (the same transactions as shown in the Sales & Invoices per day chart).
-
This table is sorted by Amount, highest to lowest
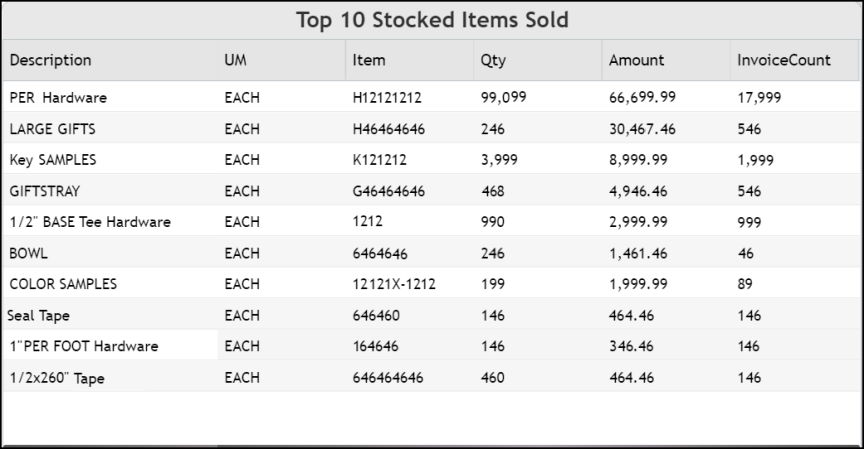
Top 10 Stocked Items Sold
Inventory
This table breaks down the inventory amounts by status:
-
MTD (Month to Date)
This amount represents the value of purchase orders placed during the current month for new inventory.)
-
Turns (Inventory Turnover)
This number is calculated by dividing Cost of Goods Sold by the average stock value for the month. Higher is better, to a point (you could make it really high by selling everything in your store without re-stocking anything but that’s obviously not good long term).
-
GMROI (Gross Margin Return on Investment)
Use this value to analyze the store’s ability to turn inventory into cash.
If you carry too much stock, the number is lower; if you make too little money on what you sell, it’s also lower.
For example, if the store’s profit margin for 2020 was 55% and the inventory turnover for that 12-month period was 2.8, the GMROI was $1.54; the store received $1.54 in gross margin for every $1 they spent on inventory, which is in line with successful hardware store averages. -
Inventory to Sales
This amount reflects the ratio reporting current WAVG inventory value divided by net sales in the prior 12 months.
You can achieve a low ratio when you have low inventory and high sales. This indicates efficiency in achieving just-in-time inventory. -
YTD (Year to Date)
This amount reflects the value of the purchase orders placed during the current year. -
Inventory (Repl. Cost)
This amount reflects the replacement cost value of inventory. -
Inventory (WAVG)
This amount reflects the weighted average cost value of your current inventory.
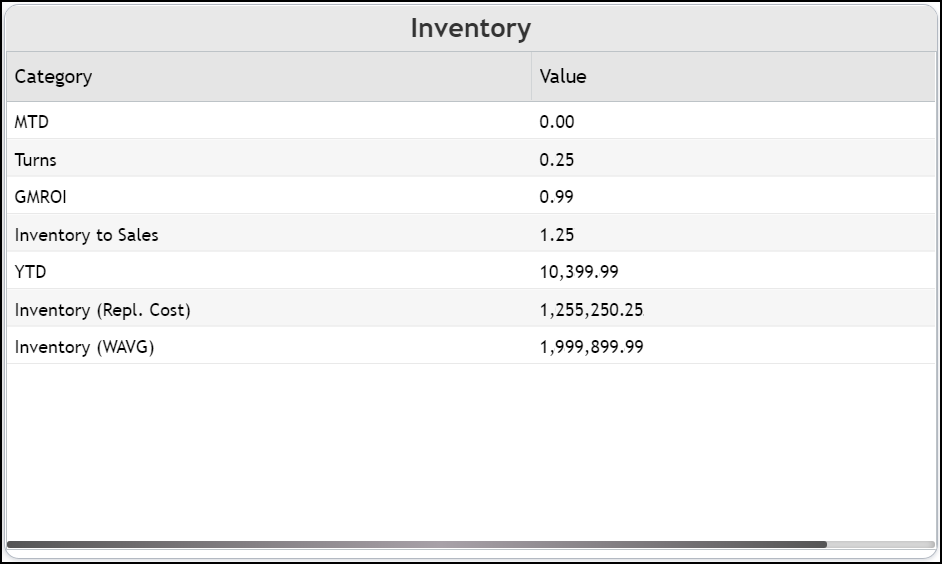
Inventory
Setting up Access to the Daily Dashboard for Store Decision-Makers
Consider the data that is in the RockSolid MAX Daily Dashboard powered by Cognytics carefully before determining who should have access.
To set up access for one or more users:
1. From the Main Menu, choose Maintenance > Database > User IDs to display the User ID Maintenance form.
2. In the User ID list, choose user ID or the user group ID to which you would like to give Daily Dashboard access.
3. In the Security Options tab, click the Permissions List ![]() icon to display the Permissions Code Maintenance box.
icon to display the Permissions Code Maintenance box.
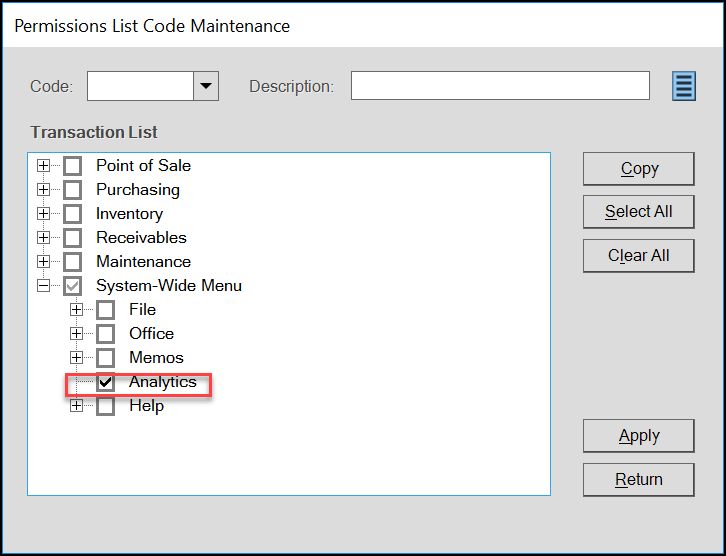
User ID Maintenance Form > Permissions List Code Maintenance Box
4. Click the System-Wide Menu and then the Analytics check box to add this permission to the selected user’s rights.
5. Click the Apply button.
6. Click the Return button to return to the User ID Maintenance form.
7. Choose Process (F12) to save these changes.